


Kubernetes is now the platform of choice for many companies to manage their applications both on-premises and in the cloud. Its emergence a few years ago drastically changed the way we work. The flexibility of this platform has allowed us to increase the productivity of the engineering teams, thus requiring new working methods more adapted to this dynamic environment.
Kubernetes requested an adaptation of the security control processes to ensure the continuity of the reliability of this system. Falco is a tool that fits into this ecosystem.
What Is Falco?
Falco is an open source tool, created by Sysdig, to continuously detect risks and threats on Kubernetes platforms, containers, on-premise systems and even Cloud activity. Falco can be seen as an agent deployed on each node (master and worker) to observe and alert in real time unexpected behaviors such as configuration changes, intrusions or data theft.
Falco is now supported by the Cloud Native Computing Foundation (CNCF) and a huge community that continues to improve and maintain the project.
Falco is mainly used by security engineers (CISO, SRE, Security analyst, etc) to detect and alert as soon as possible any deviant behavior on any system and potentially automate playbooks to fix any issue detected.
To do so, Falco relies on predefined and/or custom rules that a security team can use to extend Falco’s detection range.
What Is A Falco Rule?
The way Falco manages these rules fits perfectly in the context of the Security as Code methodology where security and policy decisions are codified to be shared and potentially maintained by multiple teams.
Falco rules are the central component of the application to identify the deviant behavior of any component on a cluster. Their definition consists of macros, lists and conditions defined in the YAML files deployed in the default folder or in a specific directory to be interpreted automatically by Falco at startup.
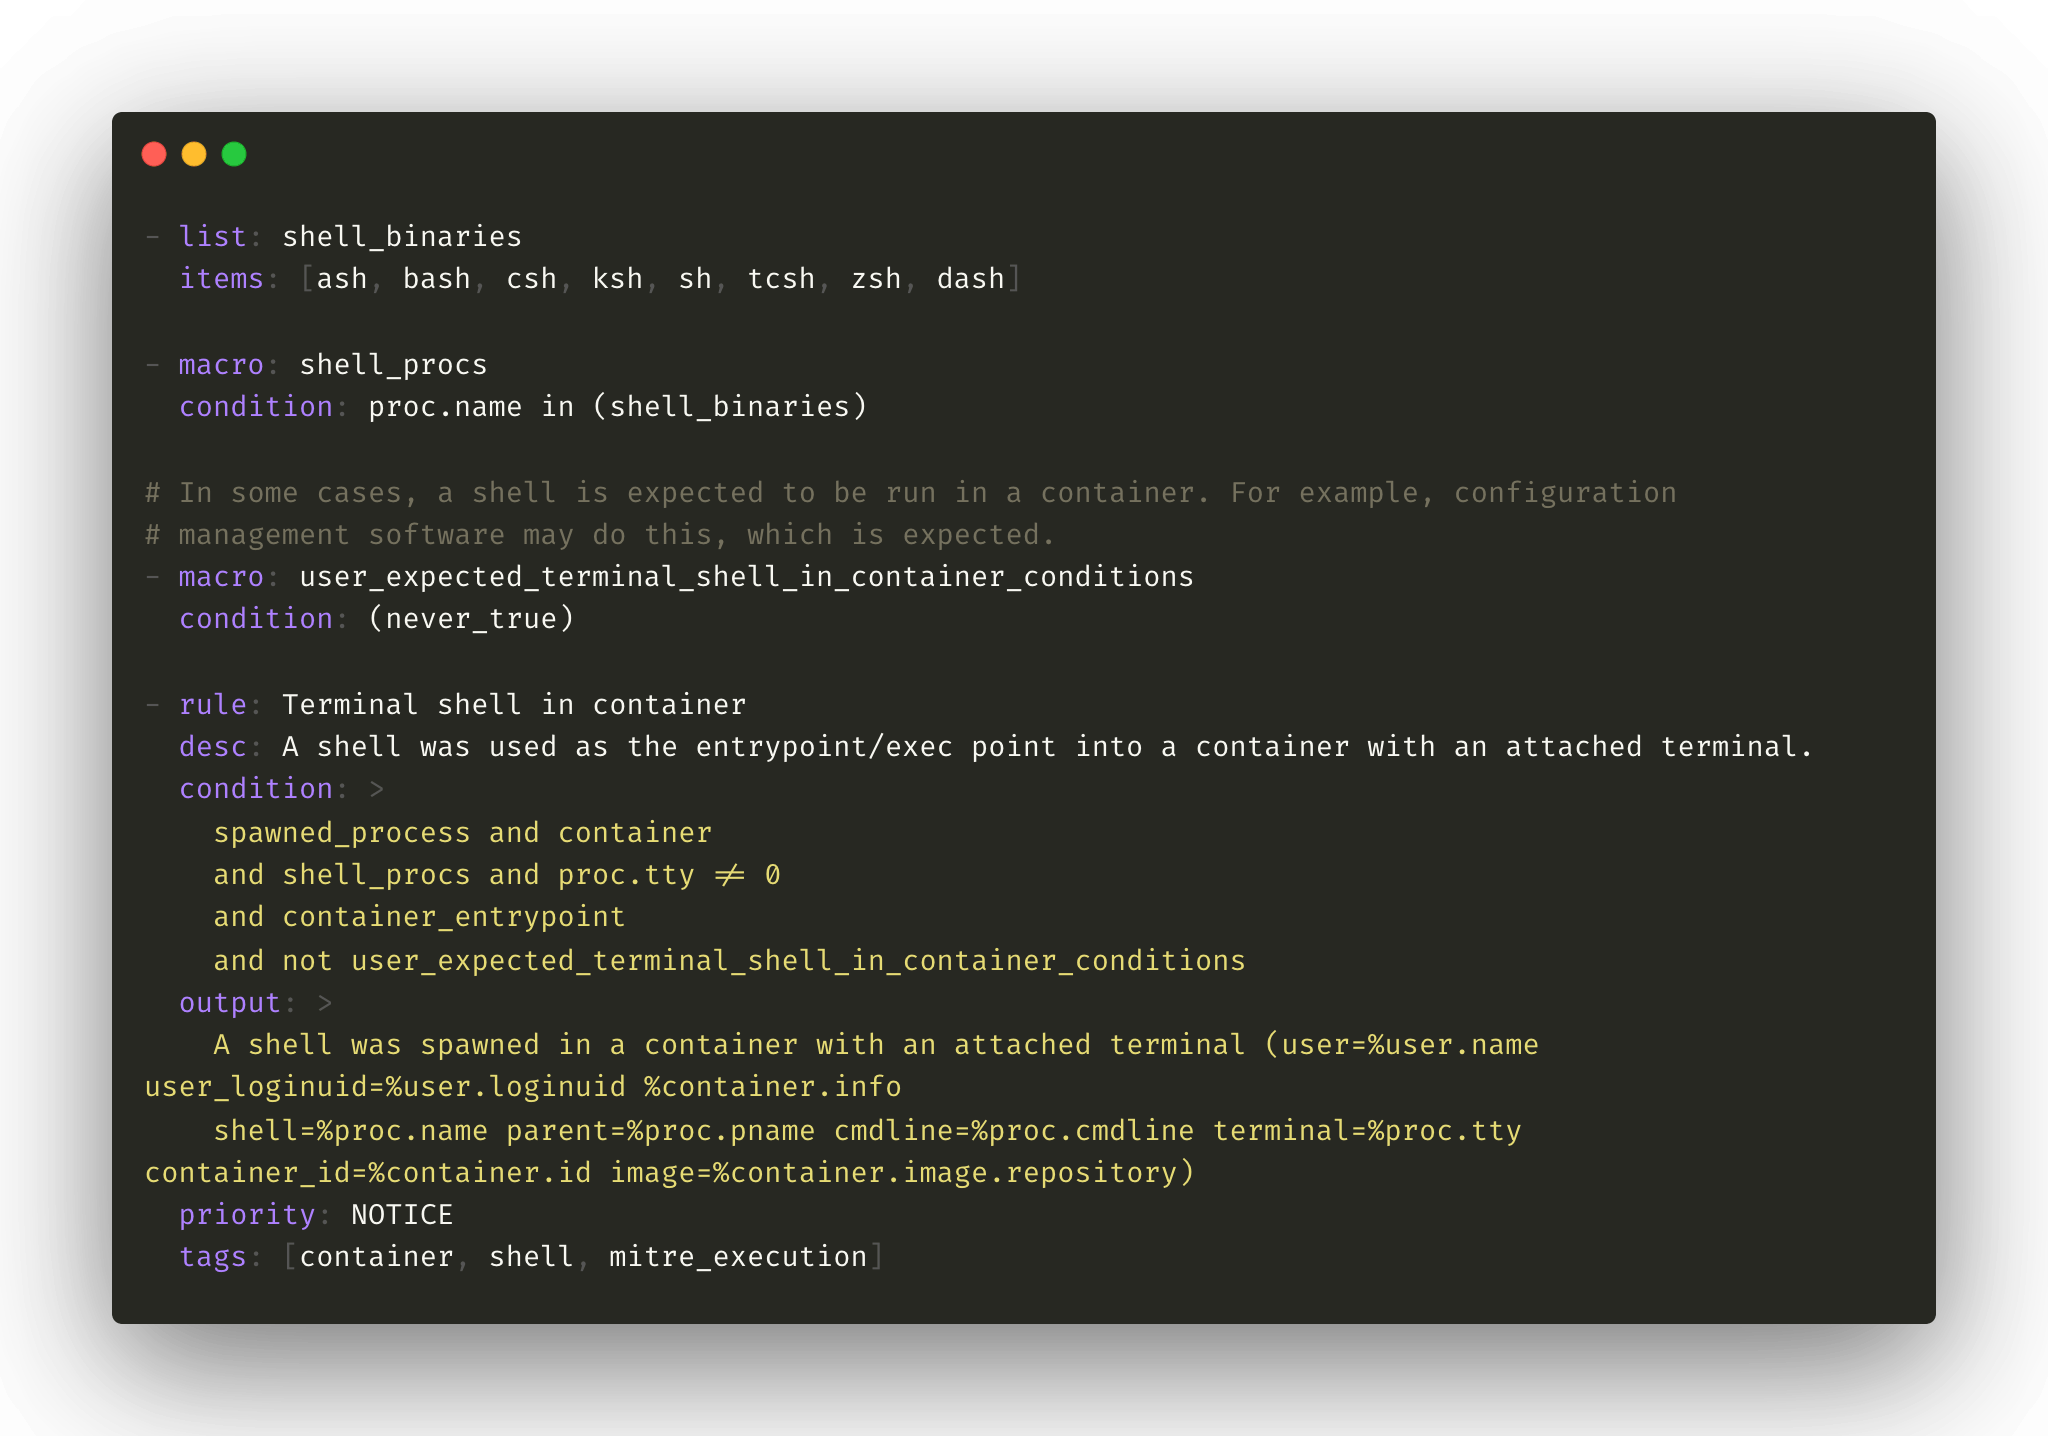
Example of a Falco rule definition to identify the execution of a shell in a container A set of default rules is maintained by the community to help monitor baseline conditions such as:
- Installation of a package in a container
- Execution of specific commands in a container like shell, bash, zsh, etc
- Manipulation of any file on the filesystem
- Unexpected SSH connection on remote location
- Unusual network activities
- Attempt to start a container with privileged mode
This is only a subset of the complete list of rules defined and used by default by the Falco agent. For more information, refer to the YAML file definition available on Github.
These rules cover most of the common anomalies identified by the community. They are a good basis for ensuring a minimum of control over what happens in your Kubernetes clusters. However, they can be supplemented by custom rules in order to be integrated into your company’s contexts. For this, it is recommended to take example on the definition of these rules and to read the online documentation in order to respect the good practices and obviously codify and version the whole configurations.
Having a project shared with all teams can facilitate the adoption and maintenance of these security policies and therefore their relevance.
How To Deploy Falco?
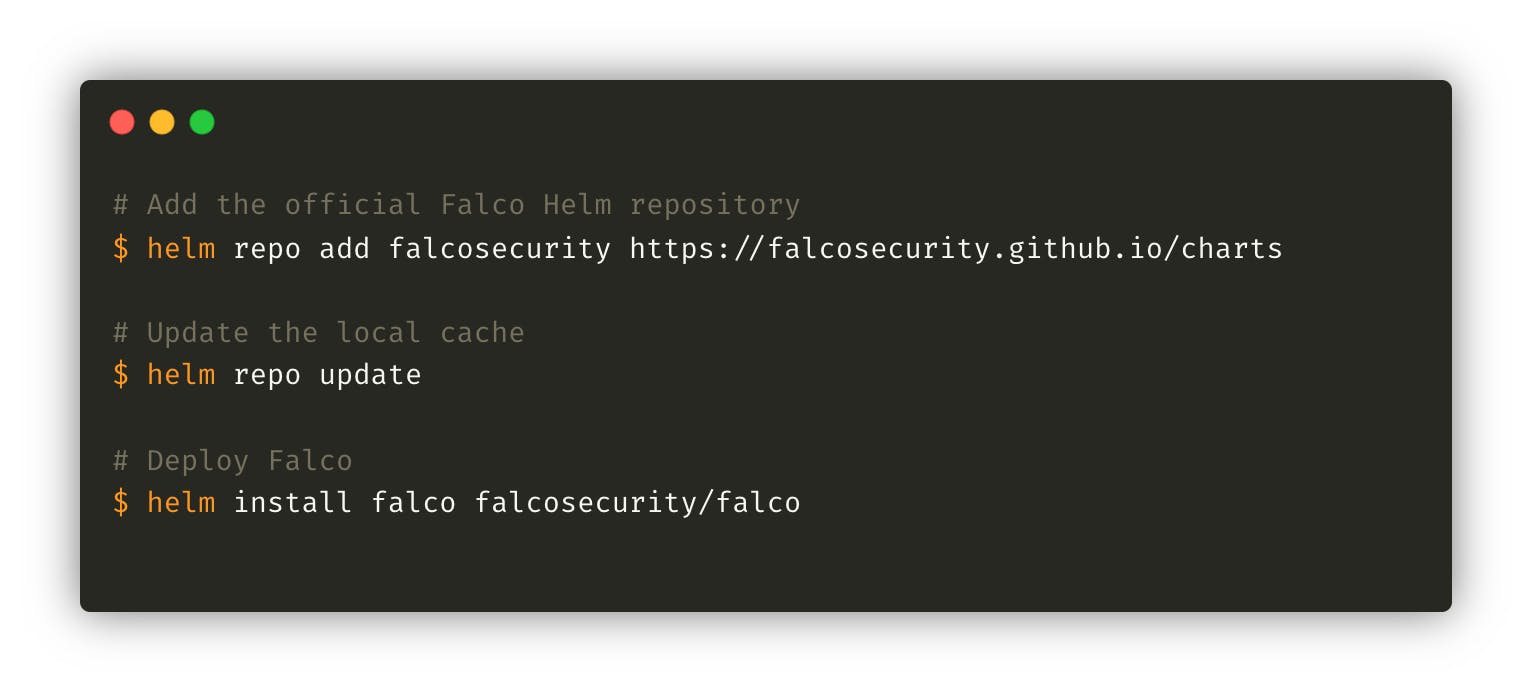
Falco has several installation options but obviously the best option on a Kubernetes cluster is the Helm Chart developed and maintained by Sysdig and the Falco community.
Falco does not require a lot of resources to operate in optimal conditions, between 150–300Mi of memory and 100m of CPU. It is highly recommended to define a priority class to ensure that the agent runs continuously even on hosts under pressure.
How To Monitor events?
Falco, in itself, has two functions, the identification of anomaly based on predefined or customized rules and the generation of an event in the form of logs for each anomaly detected. These logs are usually sent to ‘stdout’ to be readable via any client (command line or web interface). It is strongly recommended to extract these logs and centralize them on a storage space external to the cluster where they can be processed and ingested by the log management system in order to keep a history of anomalies but also generate alerts using the available internal tools.
However, there are two tools to improve the user experience by allowing you to view detected events in real time, add a visual aspect to the data and generate alerts.
Falcosidekick
Falcosidekick is an addon of Falco, developed by Sysdig, to improve the usage and consumption of the events generated by Falco.
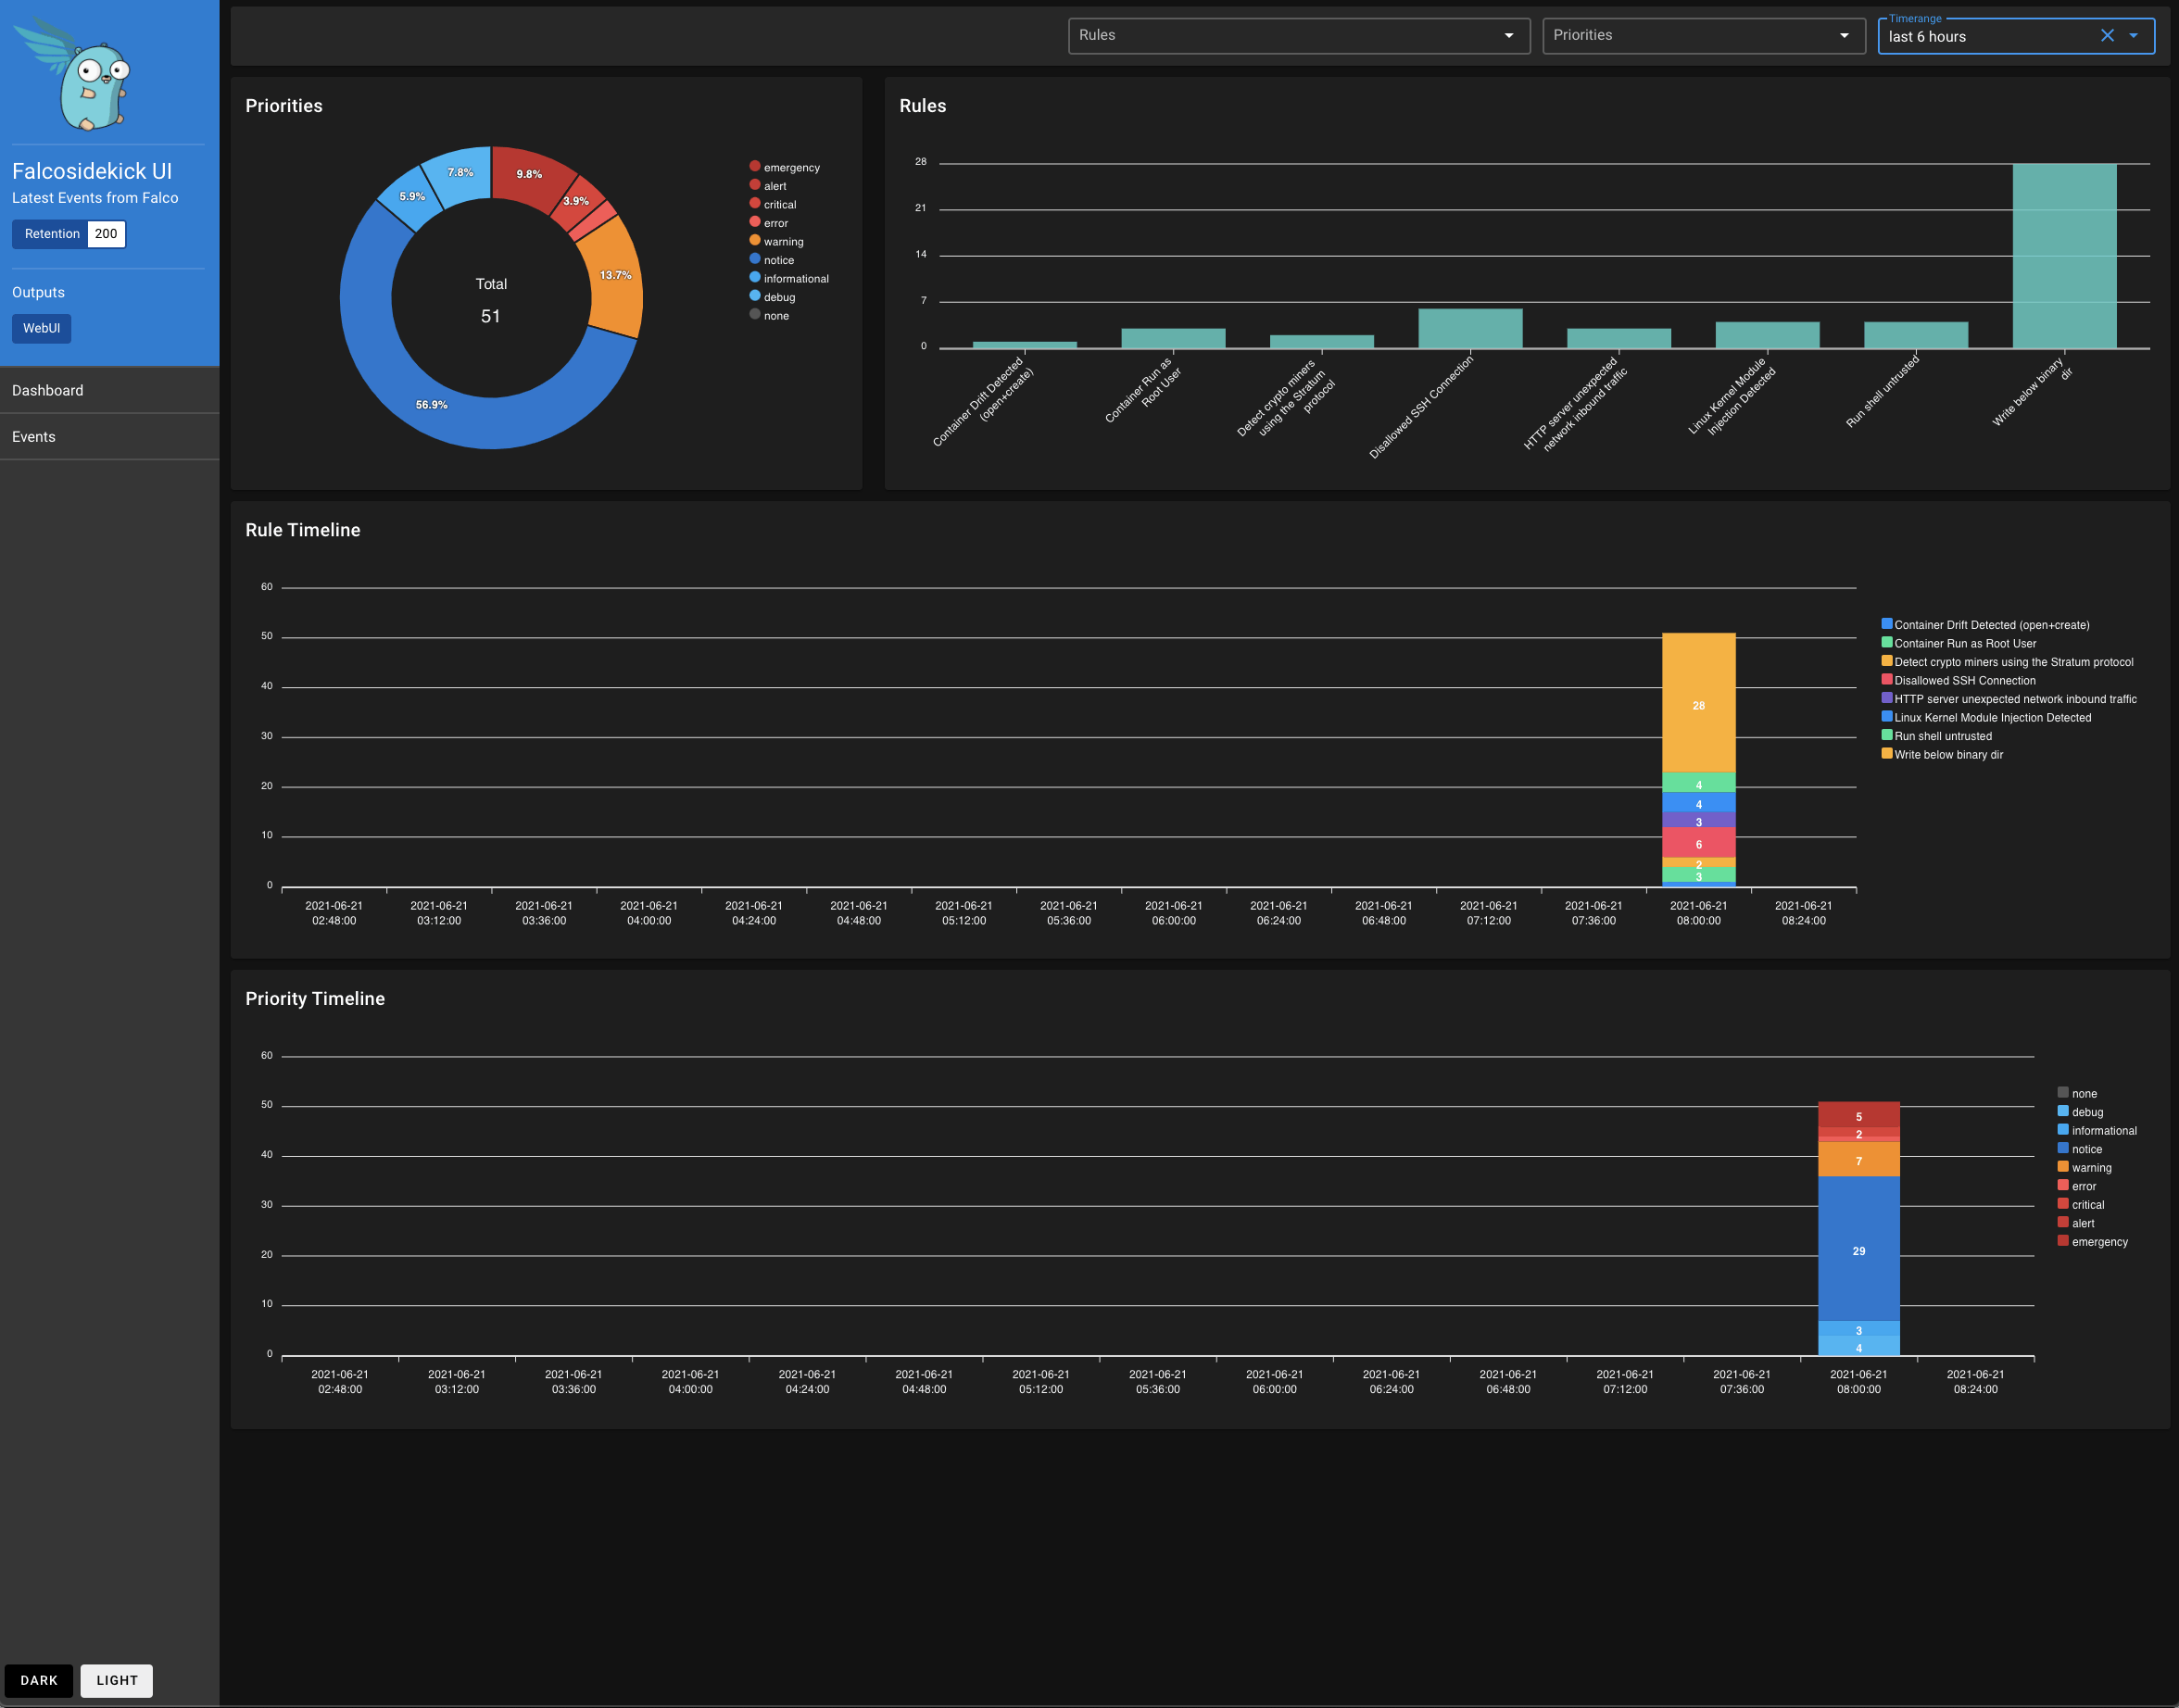
This tool consists initially of a very simple user interface allowing to consult the anomalies and extract some metrics. This user interface makes it possible to quickly identify the level of criticality of the anomalies in order to prioritize the necessary actions.
Viewing alerts in real time is a good thing but receiving an alert (mail, chat, SMS, call, etc.) is even better. Falcosidekick has an internal alert system that can be easily connected to a set of alert managers such as Slack, Teams, RocketChat, AlertManager, PagerDuty, OpsGenie, etc. and any SMTP service to get paged on critical issues.
This addon also allows automatic storage of events on an external platform such as Prometheus, Datadog, InfluxDB, ElasticSearch, etc., useful for integration with a monitoring system already in place.
Another advantage of this application is its integration with event-based serverless systems. This aspect is obviously very important when a security team is mature enough to have automated actions based on a particular event such as the re-creation of a Pod in case of detection of the installation of a package in a container. This requires an understanding of the feasibility and the time it takes to set up but brings a significant benefit for the security of a Kubernetes platform.
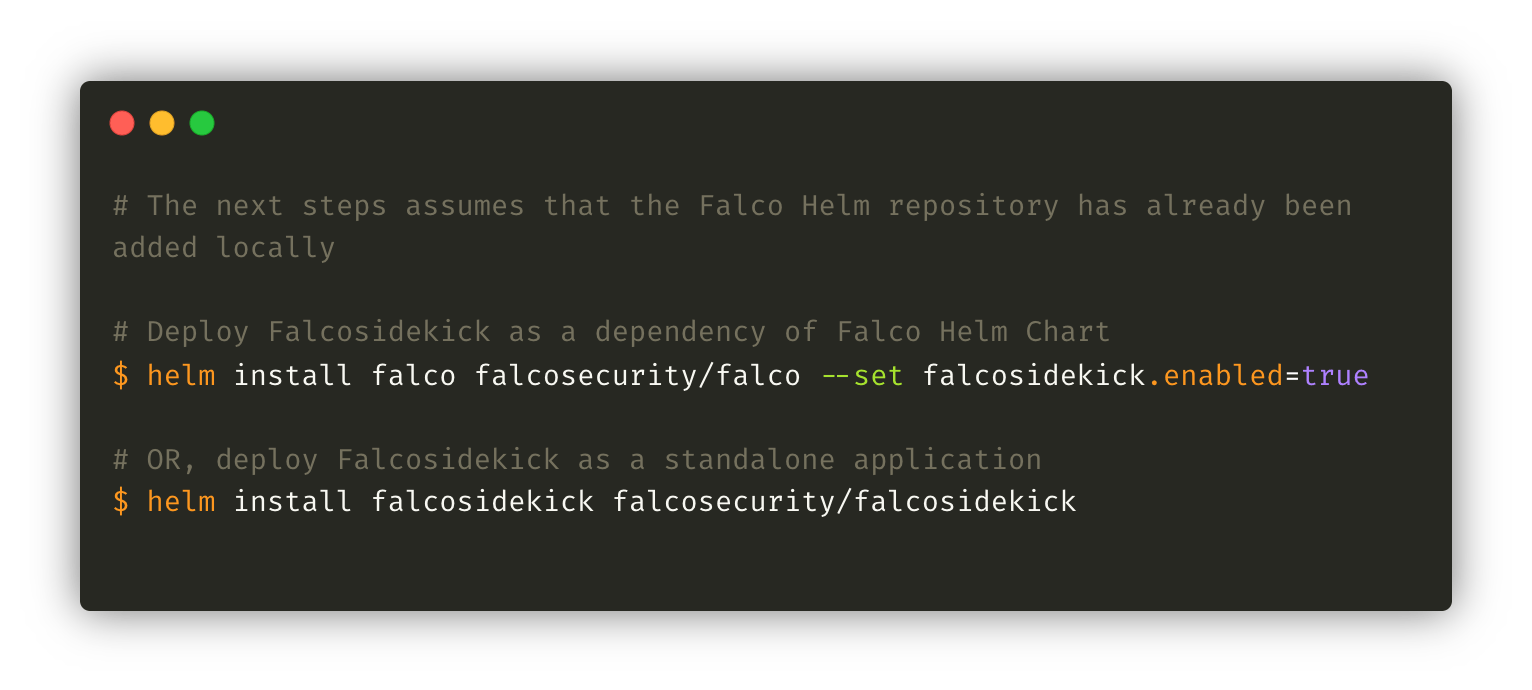
Finally, the last practical aspect of Falcosidekick is its integration with Falco’s Helm Chart as a dependency, facilitating its installation and configuration even if it can be installed as a separate project as shown in the following screenshot:
For more information on Falocsidekick, please refer to the GitHub project.
Prometheus Exporter
Another way to extract data for processing is to use the Prometheus exporter dedicated to events generated by Falco. Falcosidekick can also handle this part but depending on the context, the exporter can be a better option.
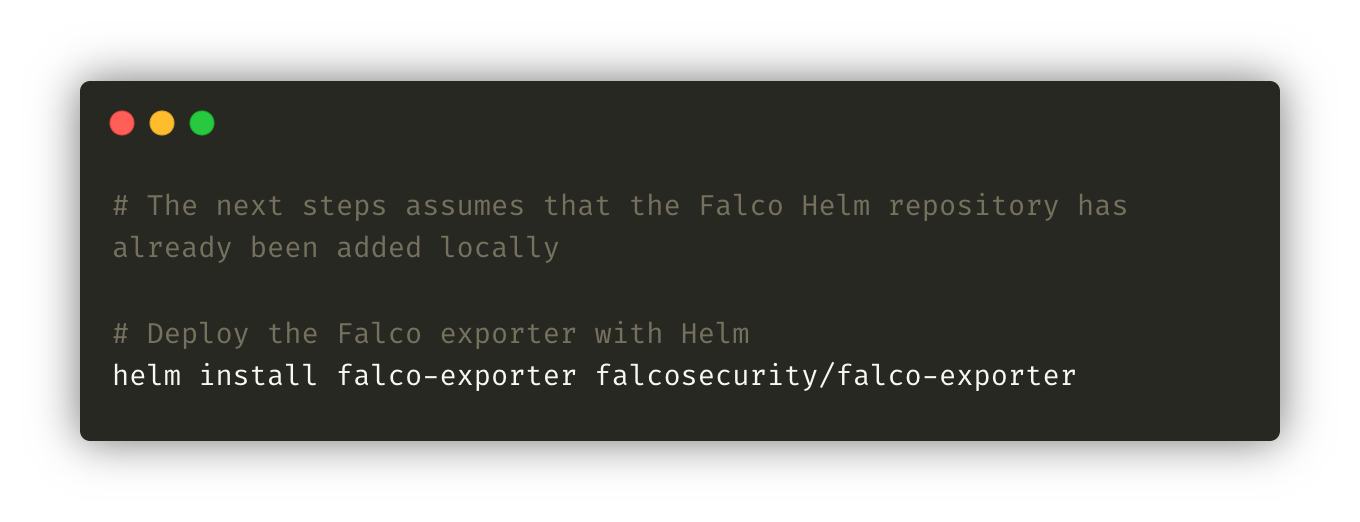
The Prometheus exporter is available on Github and can be deployed with Helm as a standalone application:
The community also provides a Grafana dashboard to easily render the metrics collected.
It is up to you to decide whether the exporter Prometheus or Falcosidekick is better suited to your use case, both are good options to outsource the anomalies detected by Falco.
How To Start With Falco?
Starting with Falco on Kubernetes is pretty easy as it comes with a preconfigured Helm Chart to deploy the stack and watch, immediately after the deployment, the unexpected behavior on the platform. But if you are looking for more information or hands-on before testing it on your platform, take a look at the Falco 101 training delivered by Sysdig for free.
This five-hours training passes through all the aspects of the tools like Falcosidekick, Prometheus exporter, Helm and more to properly guide you throughout your journey with Falco. Definitely the right way to start with this tool.
Next?
The Falco stack is a great free open source solution to improve the security of a Kubernetes platform. Customizable, easy to install and maintain, the perfect combination to start your journey!
For more information on Falco, please refer to this documentation:
- Falco project website
- Falco Github project
- Falco 101 course
- Falco: Open Source Security Tool for containers, Kubernetes and Cloud
About The Authors
Hicham Bouissoumer — Site Reliability Engineer (SRE) — DevOps
Nicolas Giron — Site Reliability Engineer (SRE) — DevOps