


Today, Prometheus is used widely in production by organizations. In 2016, it was the second project to join CNCF and, in 2018, the second project to be graduated after Kubernetes. As the project has seen a growing commercial ecosystem of implementers and adopters, a need has emerged to address specific aspects already implemented in older monitoring tools like Nagios. Blackbox service testing is one of them. What is Prometheus Blackbox?
As everyone knows, Prometheus is an open source, metrics-based monitoring system. Prometheus does one thing, and it does it well. It has a powerful data model and a query language to analyze how applications and infrastructure perform.
The Prometheus stack is composed of multiple pieces, the Prometheus server that stores and serves the data, the Alert Manager that manages the alerts and tons of Prometheus exporters that perform the metric collection.
An exporter is a software dedicated to one thing, fetching statistics from another application and exposing them to a specific endpoint (generally, a port and a path) to allow the collection of those metrics by a remote Prometheus server.
Today, many exporters exist and are maintained as part of the official Prometheus GitHub organization, others are maintained by external contributors. Blackbox is one of the official exporters maintained by the Prometheus organization.
The Blackbox exporter is a tool that allows engineers to perform one simple thing that every system administrator does every day, check the availability of HTTP/S, DNS, TCP and ICMP endpoints.
Basically, the Prometheus Blackbox exporter can be seen as a free simple alternative to PingDOM, Freshping or Uptime.com to monitor internal endpoints not exposed on the Internet.
Why Prometheus Blackbox?
The main purpose of the Prometheus Blackbox exporter is to measure the response time of remote internal and external endpoints (HTTP/S, DNS, TCP and ICMP) but it provides more than that.
The exporter provides metrics about:
- HTTP latencies, how long does it take to get access to the remote endpoints?
- DNS lookups latencies, how long does it take to resolve a DNS record?
- SSL certificates information, Is the remote endpoint secure? Is it a valid certificate? What is the certificate expiration date?
- TLS version, what is the TLS version of the remote endpoint?
- Basic authentication, can I run a simple web scenario like an authentication on a remote endpoint?
- Header validation, can I find a required parameter in the HTTP header? Does the header conform to the security compliance?
These metrics are an important piece of the infrastructure that needs to be monitored to ensure a continuity of service and compliance with some security certification.
It’s not just the client facing endpoints that need to be monitored, internal endpoints also required to be monitored to ensure continuity of service for our first customers, our colleagues.
Blackbox differs from application instrumentation (client libraries added to the code of an application to expose metrics). Blackbox implicitly validates the status of external services like DNS resolution, network connectivity, Certificate Authority, etc; whereas application instrumentation focuses on performance metrics.
Deployed on a Kubernetes cluster, this exporter can provide a free, highly available monitoring process to get a big overview of remote endpoints.
How to deploy Blackbox?
Like any Prometheus exporter, Blackbox can be deployed on an operating system or as a container. As the purpose of this exporter is to monitor critical aspects of the infrastructure, it is highly recommended deploying it on a container orchestration platform to take advantage of this type of platform:
- High availability, the most important aspect, ensuring the availability of the monitoring tools is the top priority of each administrator.
- Scalability, depending on the number of checks, Blackbox might need to be scaled.
- Portability, another big aspect of a monitoring stack, nobody can predict the evolution of the infrastructure, ensuring that a tool can be deployed on-premise, in the Cloud, in different ways is a nice to have.
- Flexibility, implementing a new tool is never easy, so having an easy integration with existing platforms like Kubernetes is a big advantage.
Blackbox is an official exporter managed by the Prometheus organization on GitHub. A Helm chart is available to easily deploy it on a Kubernetes cluster.
Depending on the Kubernetes setup, deploying the Prometheus exporter can be as simple as:
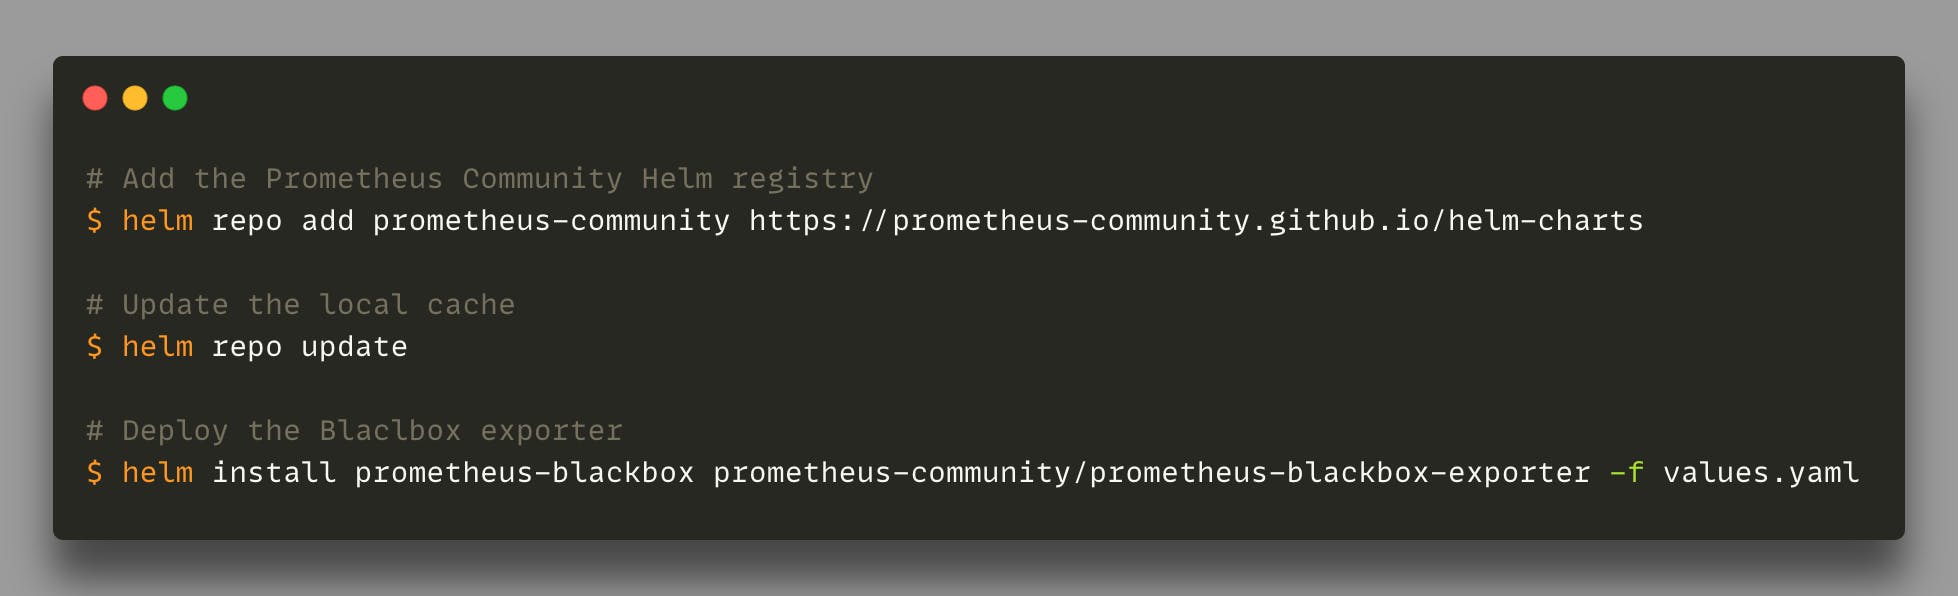
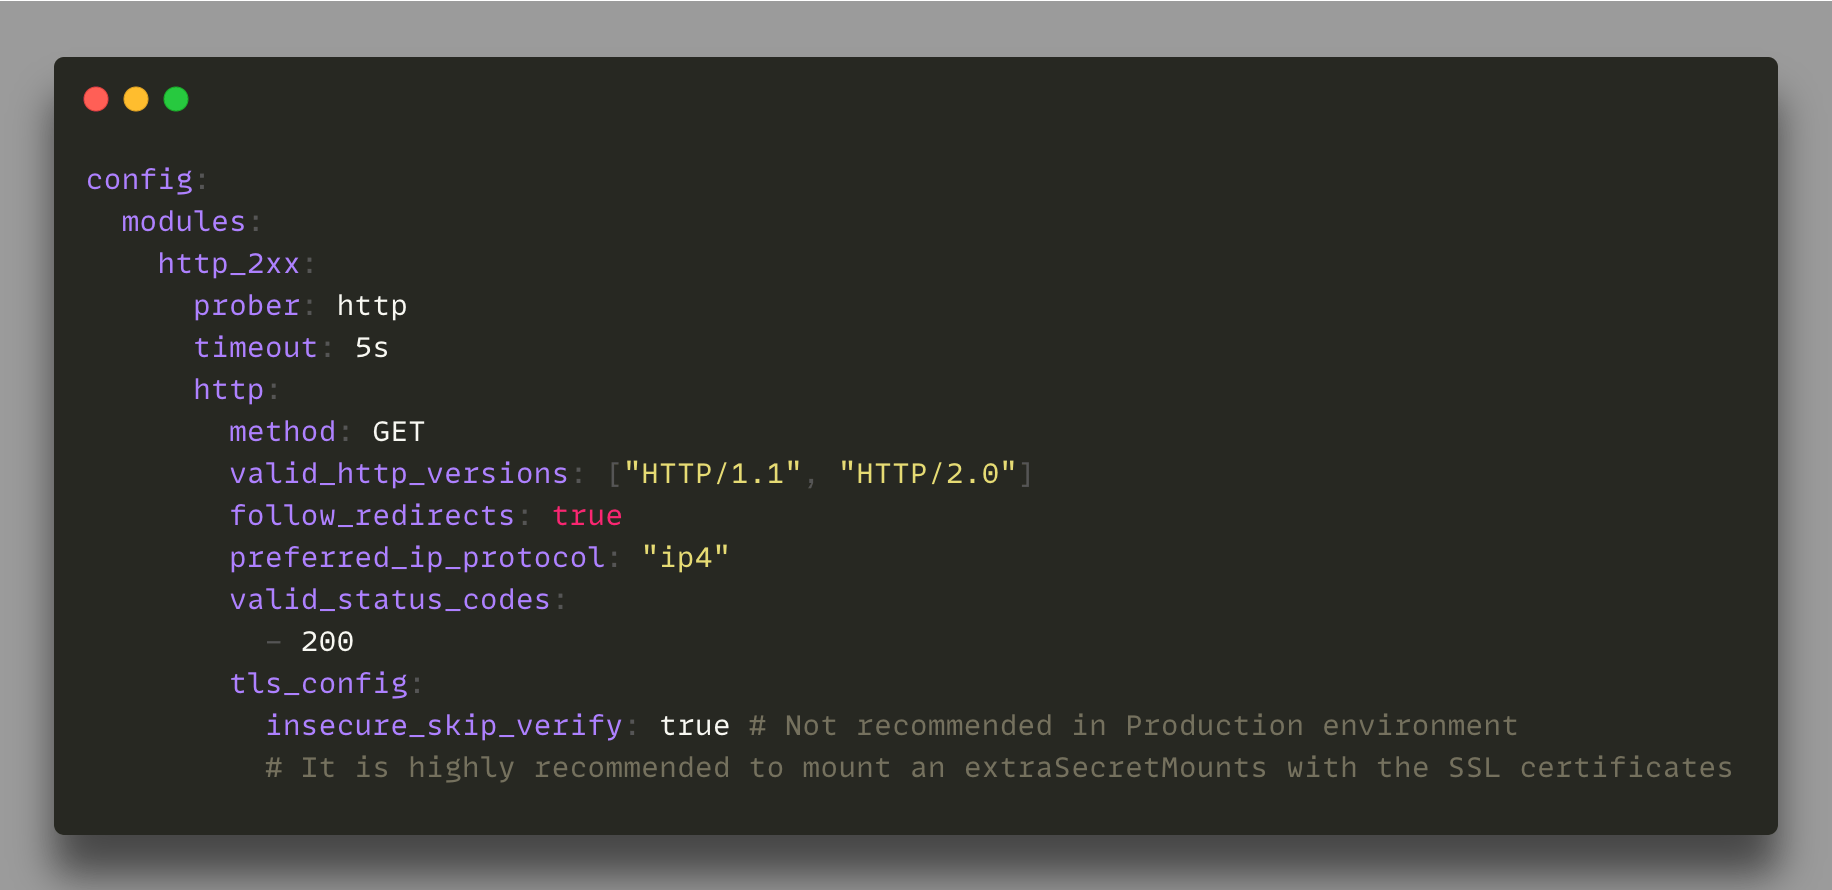
The default installation comes with a simple HTTP prober that makes it easy to start the monitoring of HTTP/S endpoints.
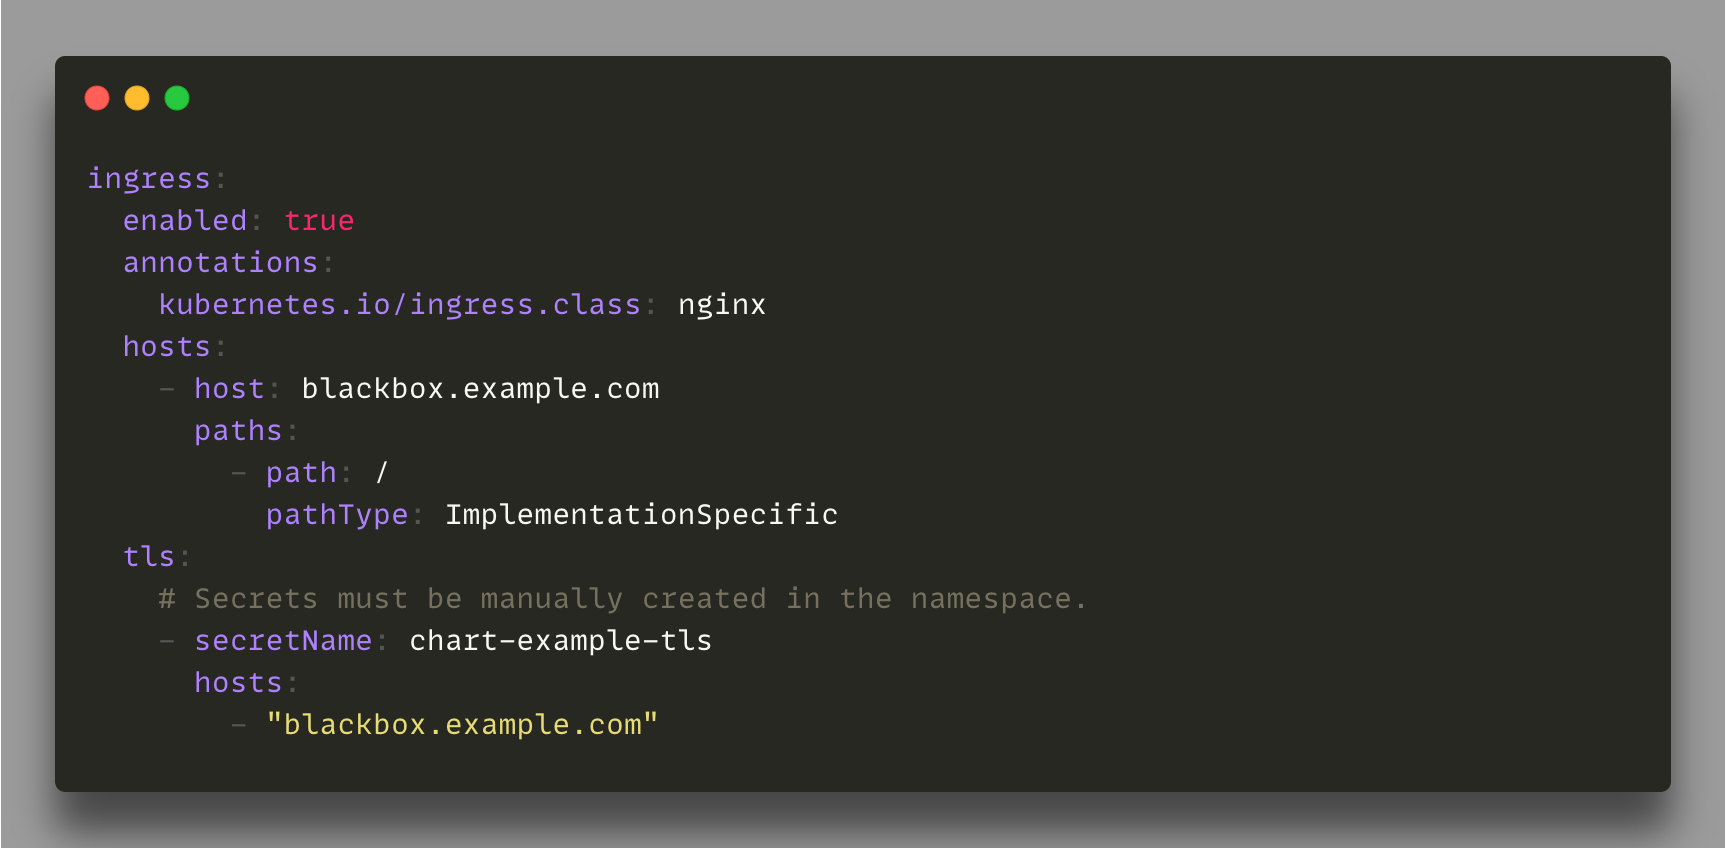
Blackbox comes with a simple web UI to easily get access to the logs of each healthcheck. An ingress rule can be enabled in the Helm chart to open access to the UI and debug the web checks:
Why and how to use Kubernetes ServiceMonitor?
Today, monitoring should not be the project of only one team. This kind of project should be spread to the entire engineering team to ensure a good coverage of each piece of the infrastructure. This means that the monitoring process should be easy to understand in order to facilitate its adoption.
The Prometheus operator introduced a new Kubernetes object named ServiceMonitor. This resource can be used to describe a set of targets to be monitored by Prometheus without any required configuration on the Prometheus server side.
This is an easy way to automatically configure a new Prometheus target. The server is able to find any Kubernetes ServicesMonitor configured with specific labels and automatically add this new target to the current list (by default, the label used is “release=kube-prometheus-stack”).
Using a ServiceMonitor object with Blackbox to monitor internal or external endpoints is a recommended approach. Adding a new check falls under the creation of a standalone object, dissociated from the configuration of the Prometheus server. This means that anyone who wants to deploy a new application can independently manage the monitoring of its application without requiring the intervention of an administrator to configure Prometheus scratch.
The main benefit is to share the responsibility of the monitoring of each resource deployed.
The Blackbox Helm chart can easily manage the creation of any new monitoring targets via a ServiceMonitor:
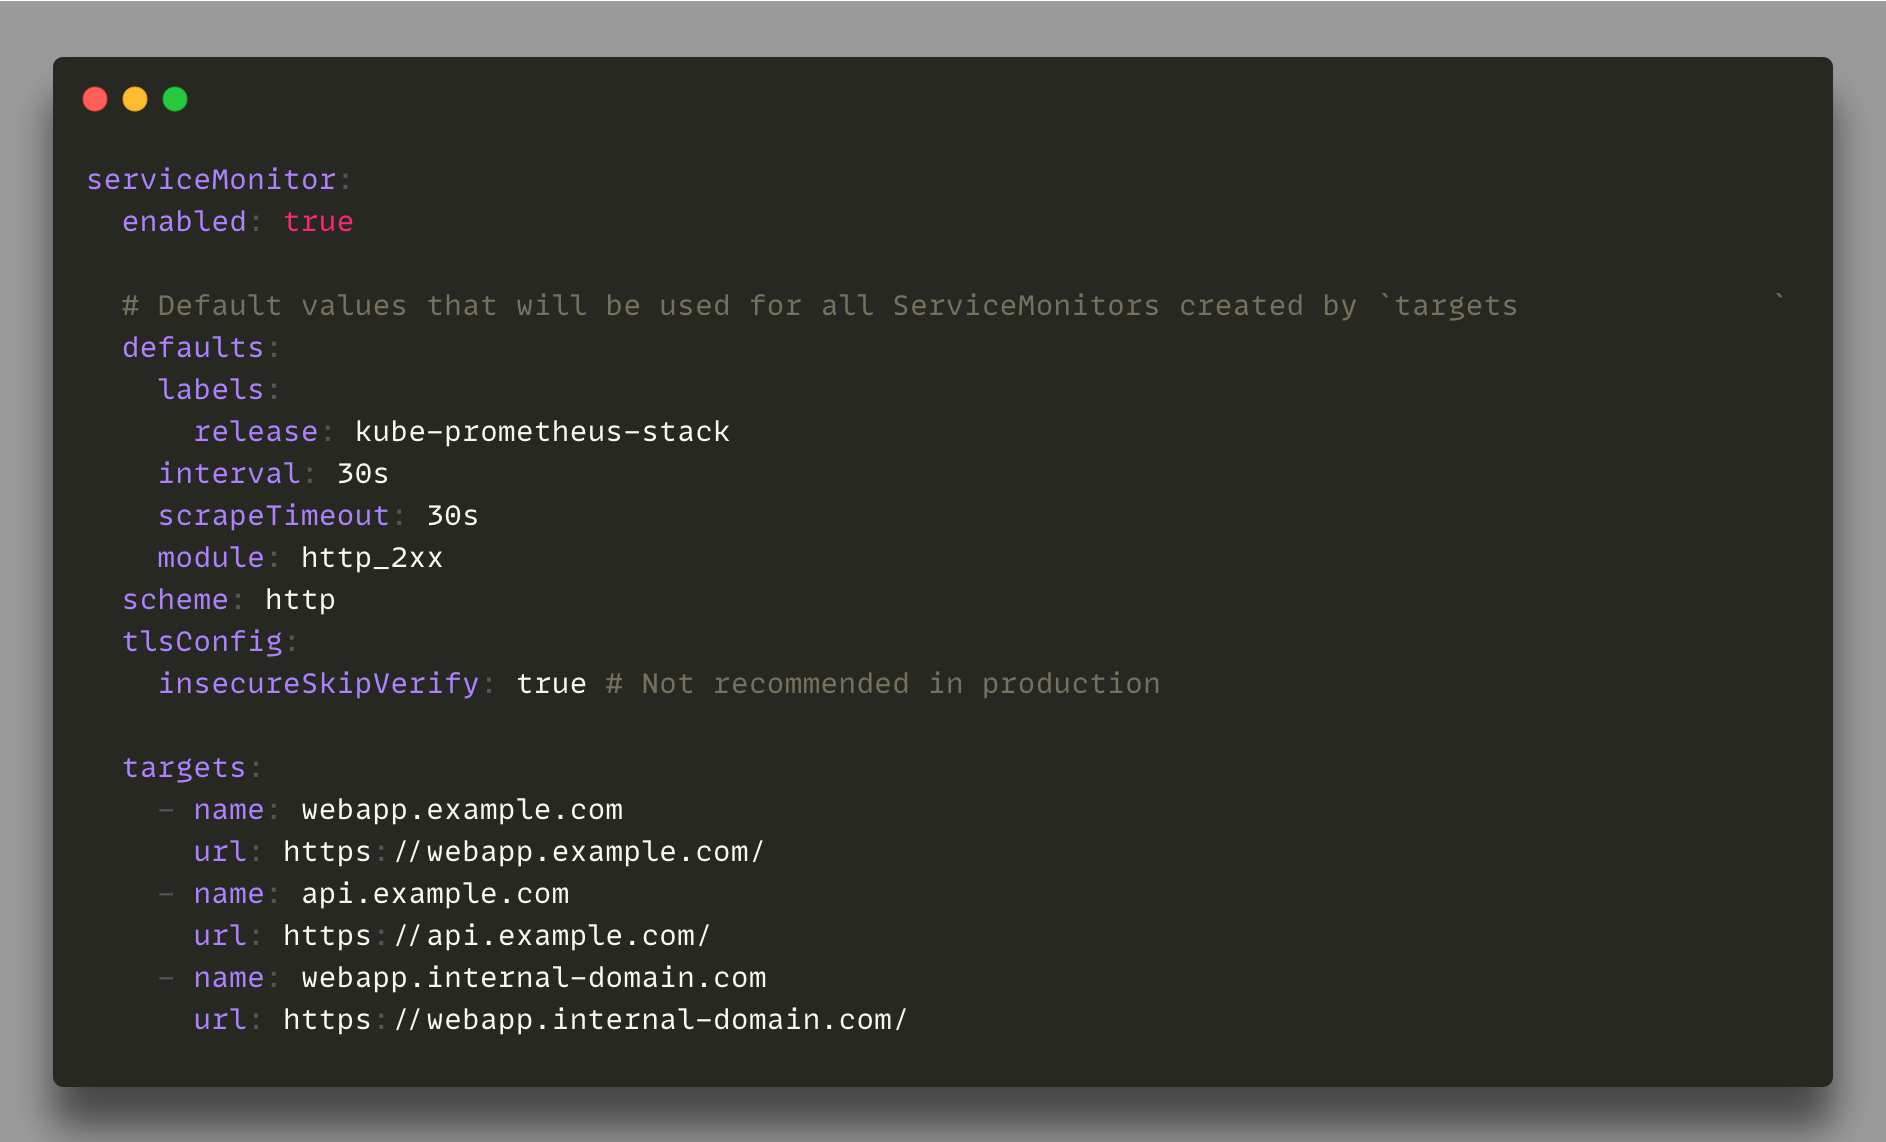
The result of this configuration is the creation of three different ServiceMonitor objects with the specific label kube-prometheus-stack, each one dedicated to the configuration of a new Prometheus target.
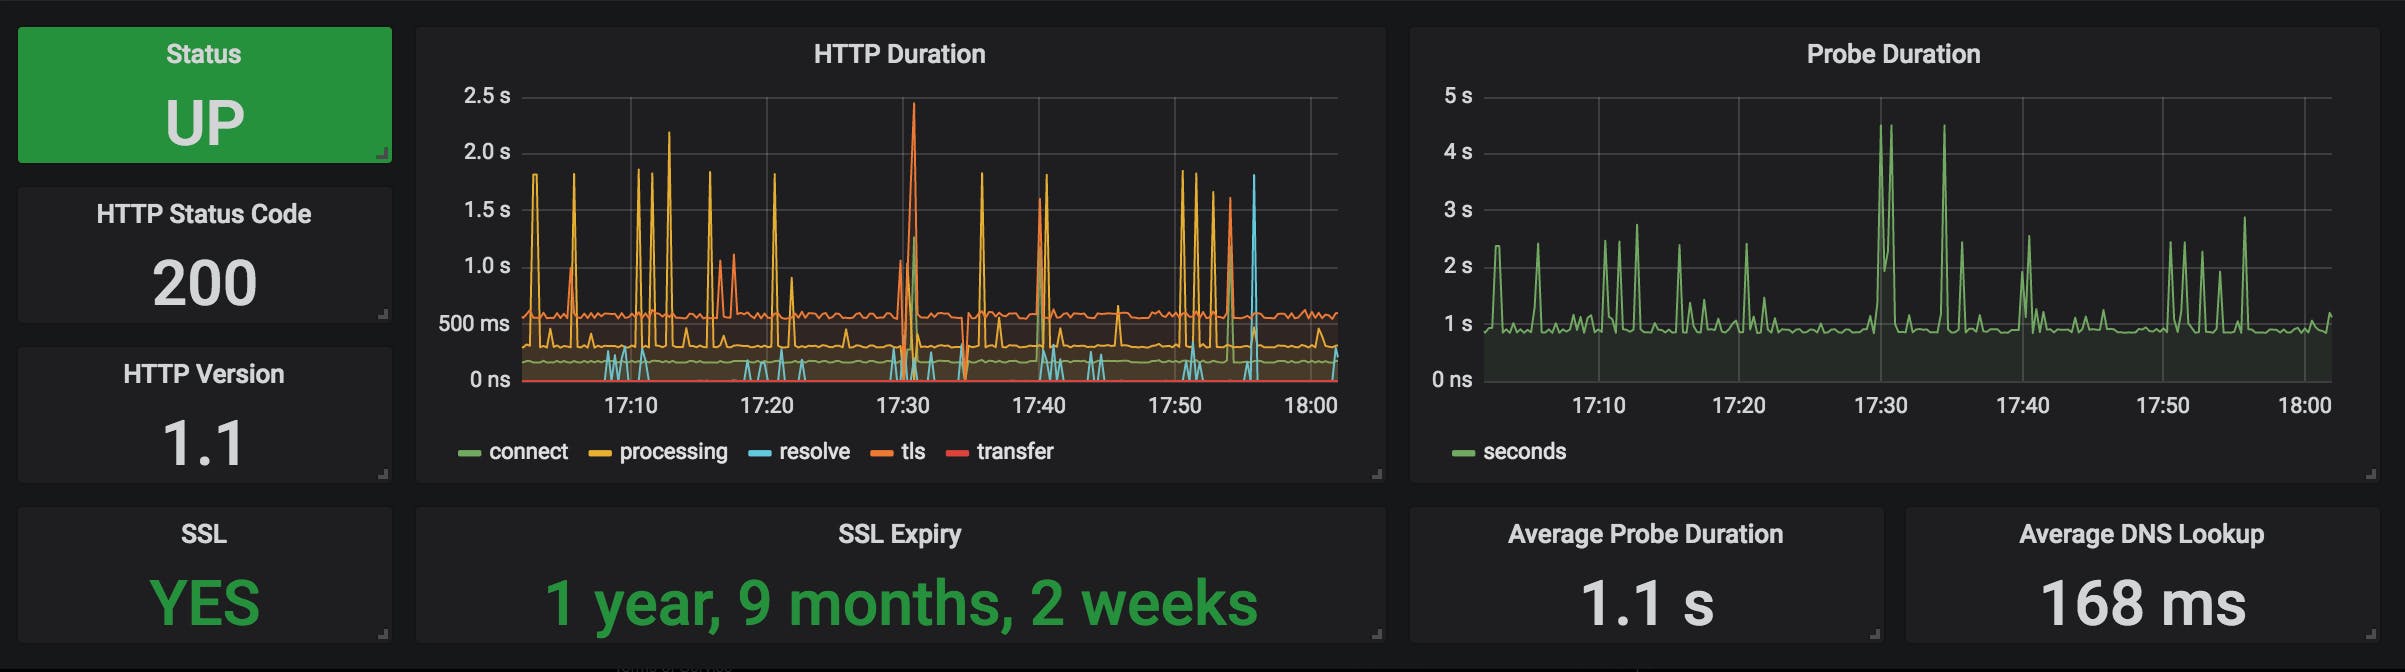
How to graph the data?
Blackbox comes with a web UI that gives some information about the checks, but this UI cannot be used on a daily basis to monitor correctly the status of multiple endpoints.
Grafana is perfectly integrated with Prometheus and is probably the default option of everybody to graph the metrics gathered by any Prometheus exporters.
Blackbox is not an exception, multiple dashboards exist today to format the data in human-readable graphs. Two of them are particularly interesting:
- 9115-blackbox provides a big overview of all the monitored endpoints in a single table to quickly get the status of each one.
- Prometheus Blackbox Exporter provides an overview of each monitored endpoint in a dedicated section for each one.
These two dashboards can be merged together to optimize the rendering and focus your time on one dashboard instead of multiplying the number of dashboards for the same data source.
Obviously, this is just two dashboards from many others, feel free to upload your own dashboard to share it with the community!
Next?
Blackbox is an interesting exporter that can be easily deployed on modern platforms to perform important checks on critical aspects of the infrastructure. Coupled with a dynamic Grafana dashboard, it can improve measurement of SLAs and give a big overview of the infrastructure to an Executive team.
For more information on Prometheus Blackbox:
- Github repository
- Helm chart to deploy Blackbox on Kubernetes
- Monitor Availability Metrics with Blackbox exporter and Sysdig
- How Prometheus and the blackbox exporter makes monitoring microservice endpoints easy and free of charge
- Getting started of the Prometheus operator
About the authors
Hicham Bouissoumer - Site Reliability Engineer (SRE) - DevOps
Nicolas Giron - Site Reliability Engineer (SRE) - DevOps