


No, YAKD is not a new Kubernetes Dashboard project, but that could be a good name for a new Kubernetes Dashboard application.
The purpose of this post is to list some existing dashboard projects. The number of dashboards seems to be increasing each day, although some projects listed below already meet all the requirements of a dashboard application.
A dashboard is a web-based Kubernetes user interface. The main purpose of a dashboard is to manage the life cycle of containerized applications deployed in a Kubernetes cluster. Fortunately, a dashboard comes with other benefits to make any operations on a cluster easier like troubleshooting a containerized application, and managing the cluster resources.
The main benefits of a dashboard are to get an overview of applications running on a remote cluster, and create or modify individual Kubernetes resources, like scaling a Deployment, initiate a rolling update, restart a pod or deploy new applications using a deploy wizard.
Basically, a dashboard provides information on the state of a Kubernetes cluster and its resources, and potential errors that may have occurred.
This post lists a bunch of projects. Some of these aim to be more than a simple Kubernetes Dashboard. The usage of each tool depends on the use cases. For example, someone would prefer to work with a local application rather than using a shared dashboard deployed in a Kubernetes cluster. Up to you to make your choice between these following projects.
Kubernetes Dashboard
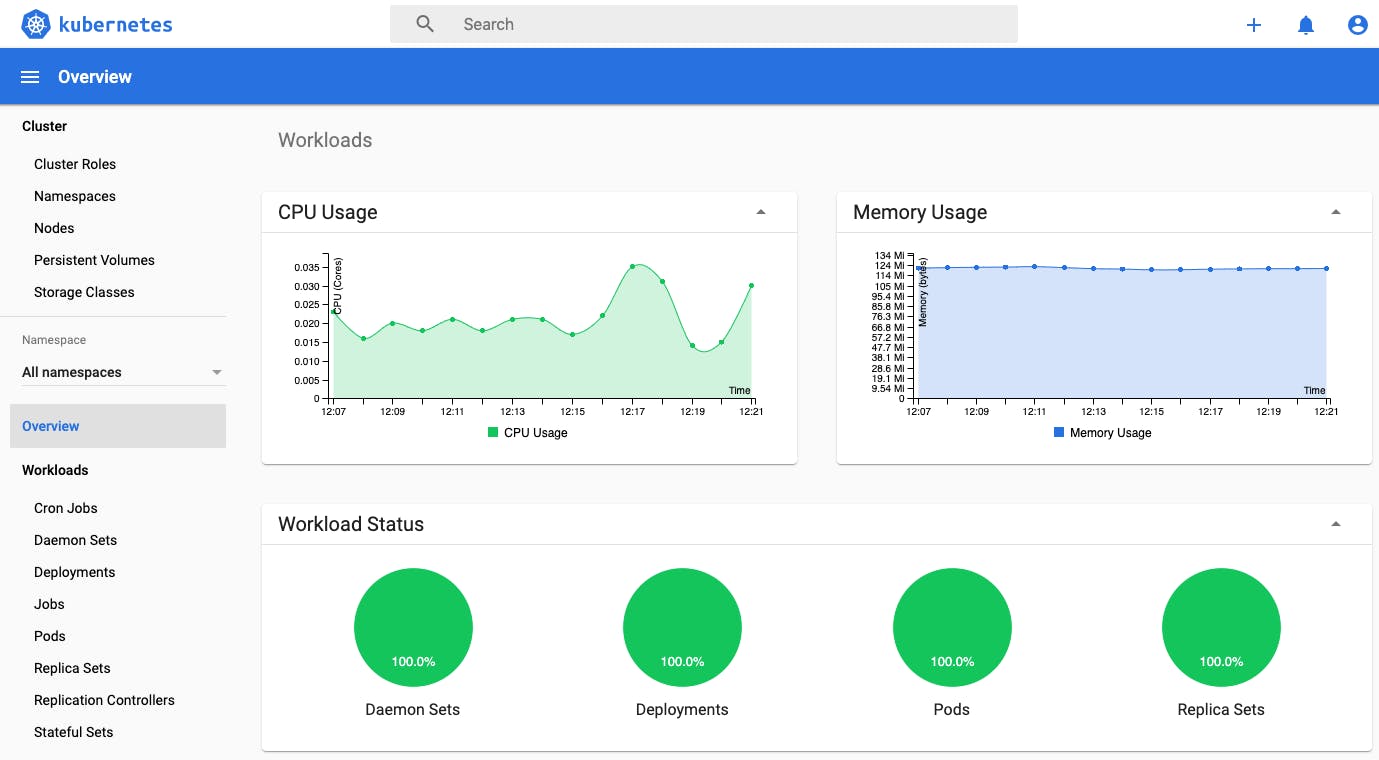
Let’s start with the default Kubernetes Dashboard project, kube-dashboard. This dashboard is the most popular and mature Kubernetes UI client. This web UI dashboard gives an overview of containerized applications running on a remote Kubernetes cluster and the ability to manage the main Kubernetes resources like Deployment, Services, Jobs, etc.
Deployed in a Kubernetes cluster, it provides all the features an operator could expect:
- Centralized UI to manage a Kubernetes as a team.
- Easy UI to manage any resources.
- Troubleshooting features like container log access, metrics, SSH connection.
Since Kubernetes Dashboard has to be installed in a Kubernetes cluster, it requires a good management of authentication and authorization, but setting up these processes is not that straightforward.
This project is probably a good start to demystify the complexity of the management of a Kubernetes cluster but compared to other clients, it has limited ability to filter resources on labels which can be a pain point in daily basis maintenance.
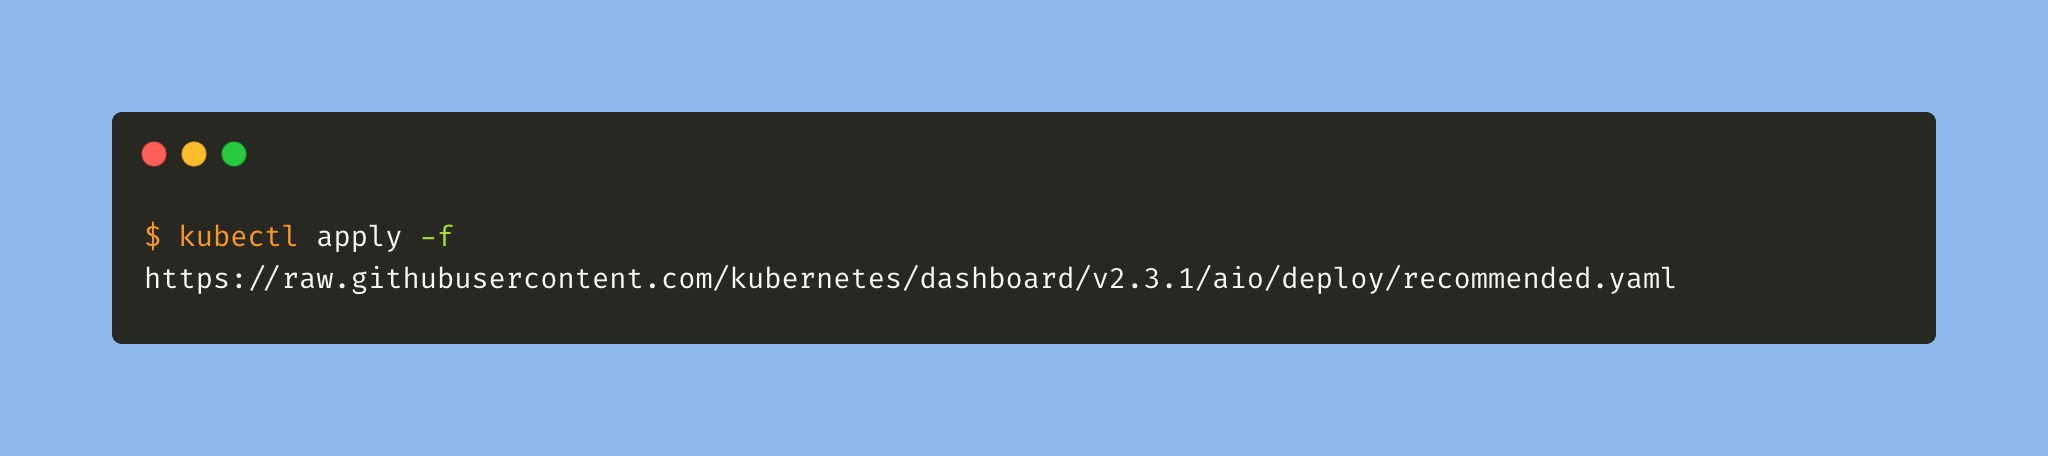
To install it on a remote Kubernetes cluster, follow this instruction:
For more information on the project, please refer to these external links:
Lens
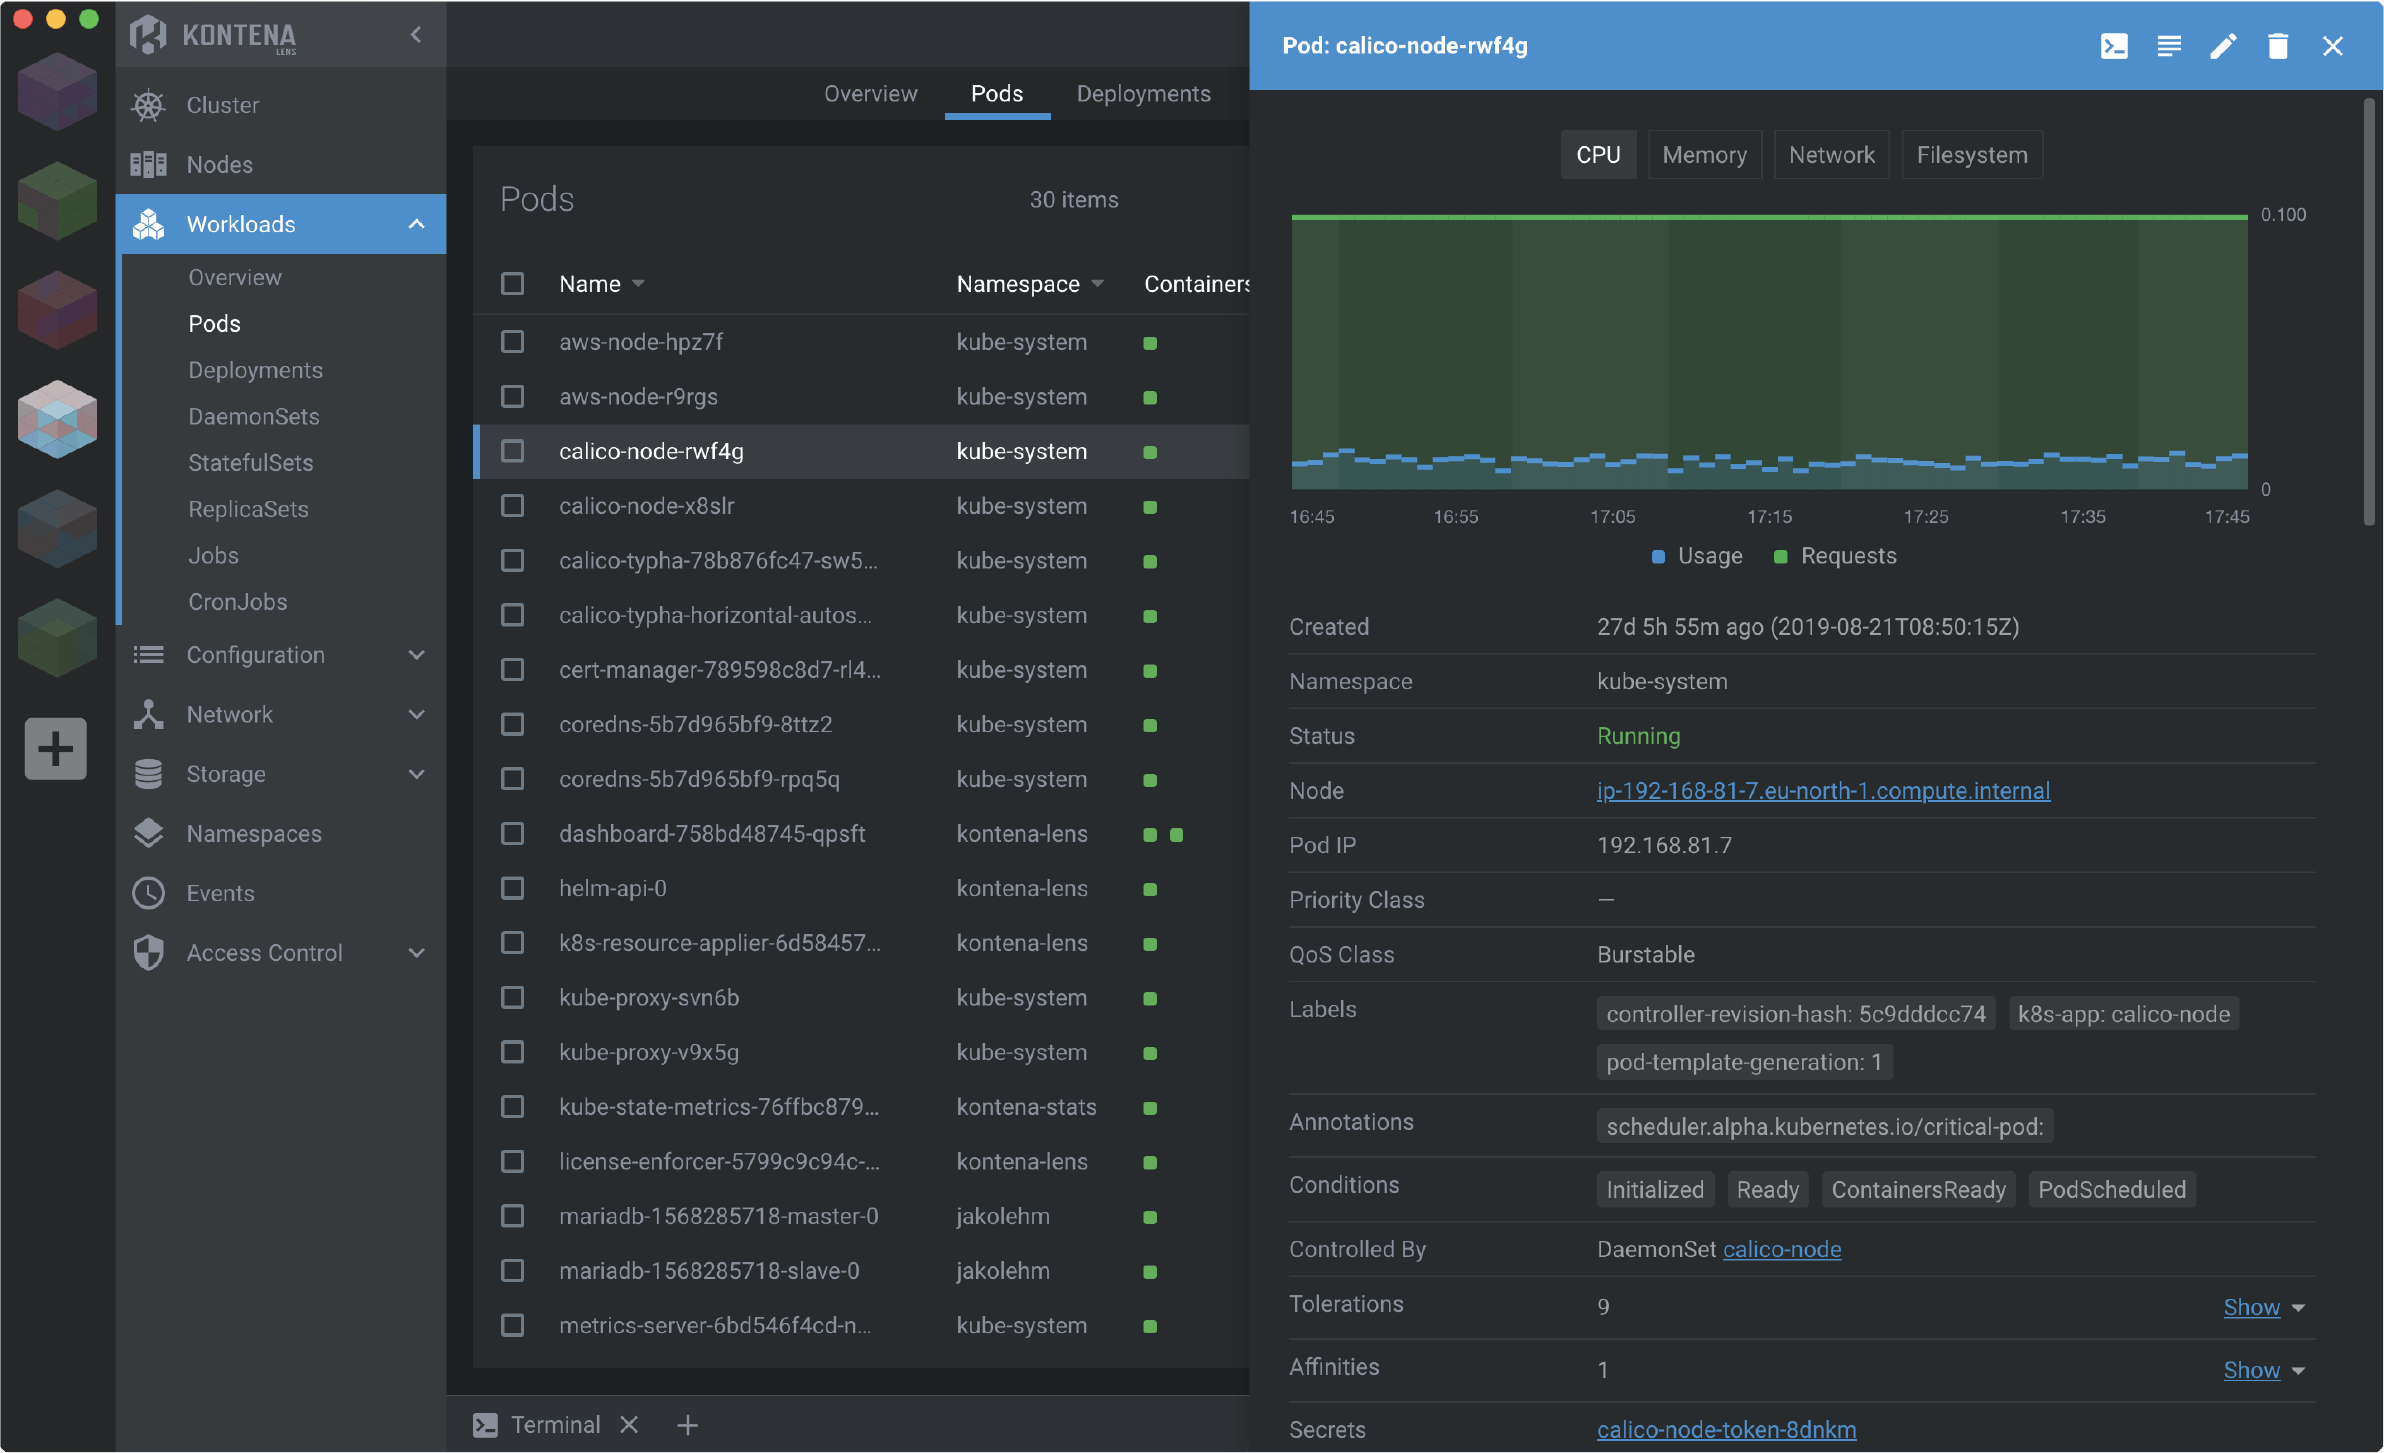
Let’s continue with probably the most famous Kubernetes Dashboard application used by every operator and developer today.
Lens is an Electron-based application (supports Windows, macOS, Linux). It was originally developed by Kontena, and has been released as an open source project after Mirantis acquisition.
Lens, in some way, is the opposite of kube-dashboard. It is a client side application which can replace Kubectl.
It provides the same features as the Kubernetes Dashboard project, plus other useful features like:
- Custom Resource Definition (CRD) management, several projects are now working on their integration with Lens as a plugin to quickly access all the information without requiring any Kubeclt command.
- Helm integration to easily manage any Helm release deployed.
- Overview of Kustomize resources and integration.
- Can replace Kubectl as Lens is able to handle the cluster setting and run any Kubectl commands.
This project is probably today the most powerful GUI to operate a Kubernetes project, but it requires the management of specific authentication/authorization as it is not a centralized tool.
This project is particularly useful to easily troubleshoot any resources automatically deployed by a GitOps Operator. It easily gives access to any Kubernetes events, logs and metrics to quickly identify any issues.
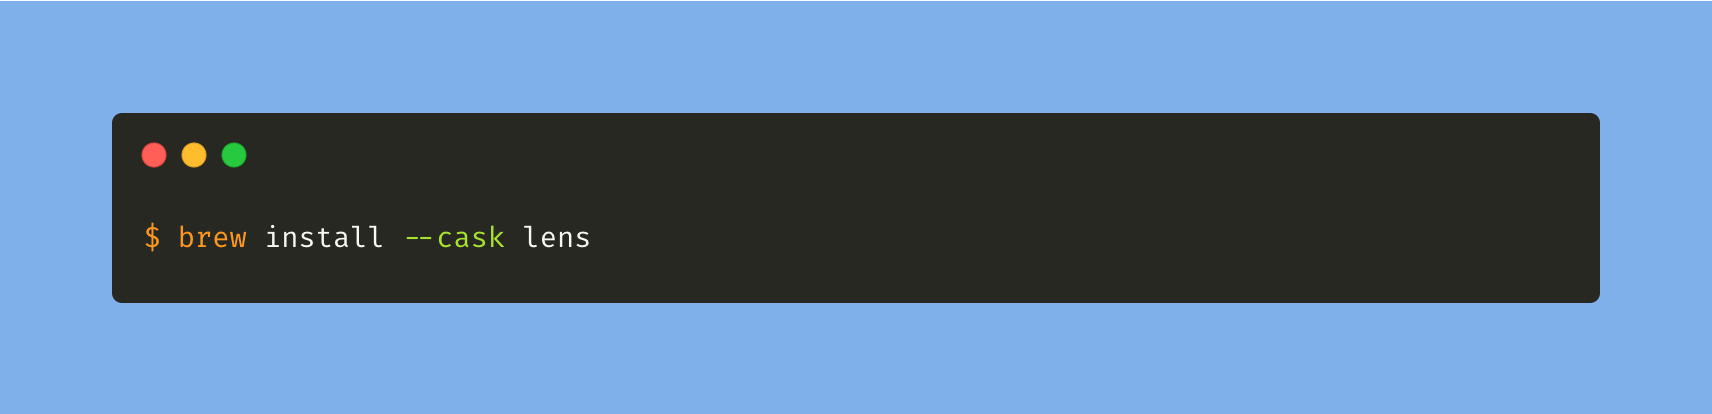
To install Lens on MacOS, follow this instruction:
For more information on the project, please refer to these external links:
Octant
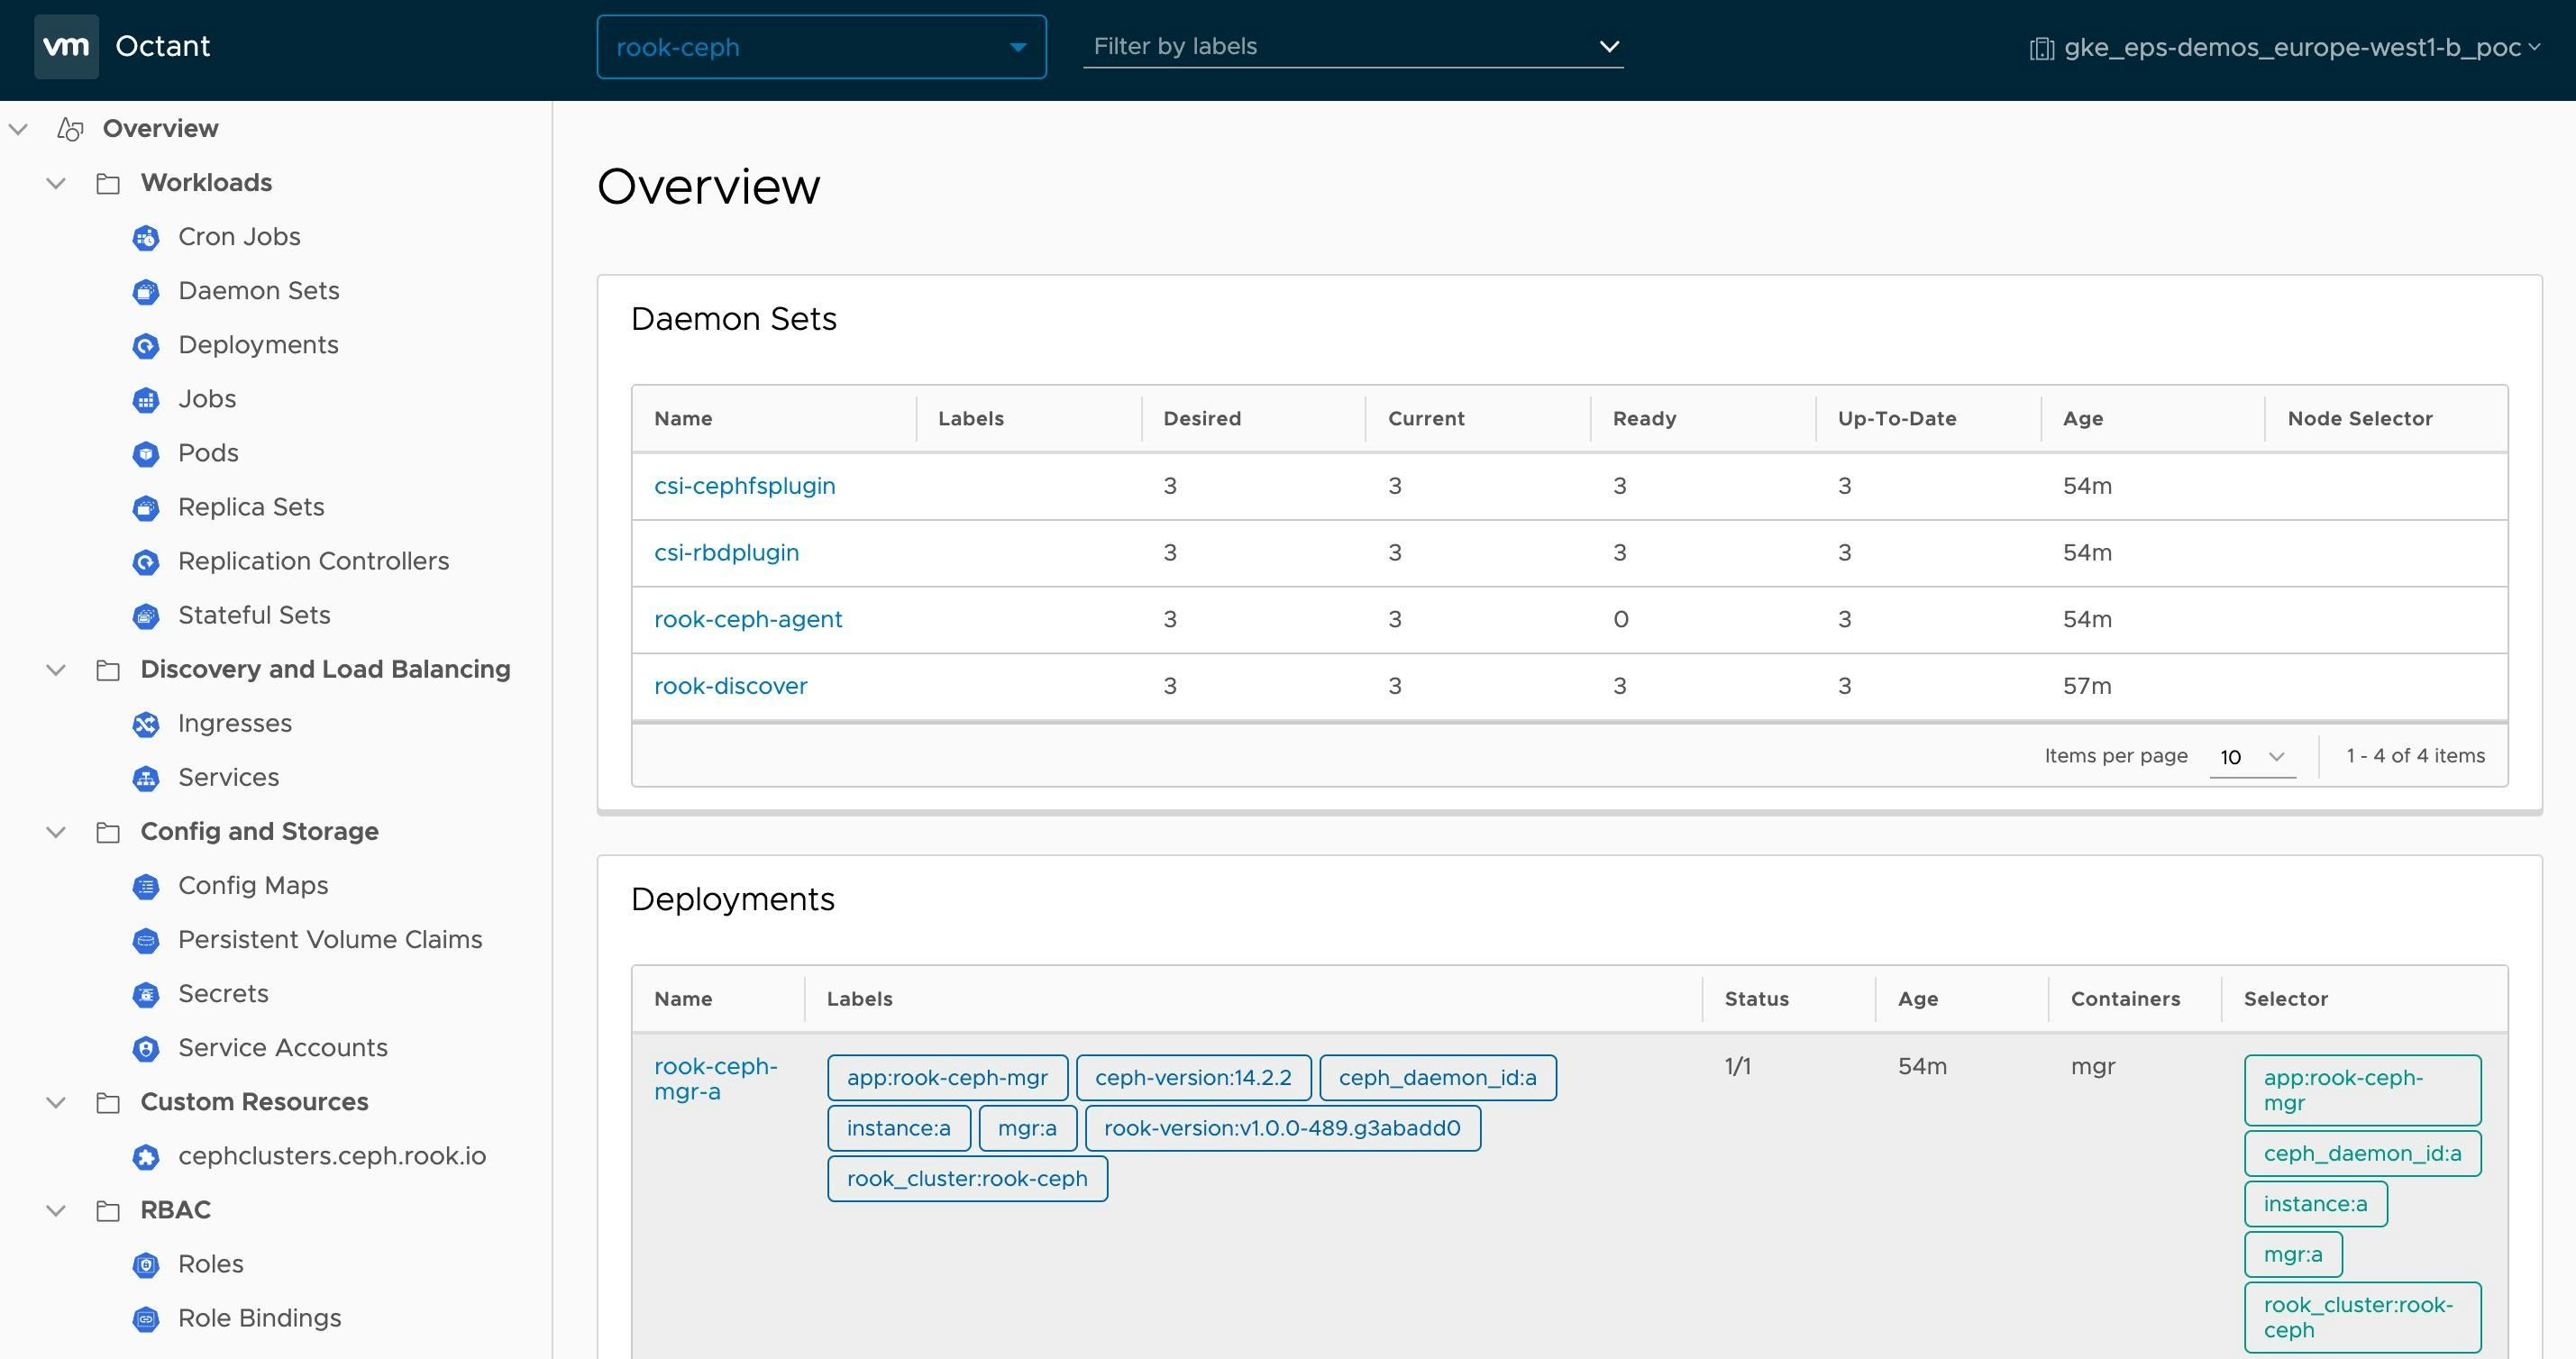
Octant is an open-source web-based tool built by VMWare Tanzu that helps to understand how applications run on a Kubernetes cluster. It aims to be part of the developer's toolkit for gaining insight and approaching complexity found in Kubernetes. Octant relies on the local Kubectl configuration to automatically connect to a remote Kubernetes cluster (/.kube/config or KUBECONFIG environment variable). Compared to Lens, Octant consumes significantly less resources, especially memory.
Octant offers features that other traditional clients have as well such as log streams, a graphical display of all resources, switch between clusters, etc… The most singular feature it has is its plugin system, which allows you to design plugins based on the information that you want on your interface. Although this requires knowledge of Go and the plugin system, you can customize your experience entirely to the way that you want it to be.
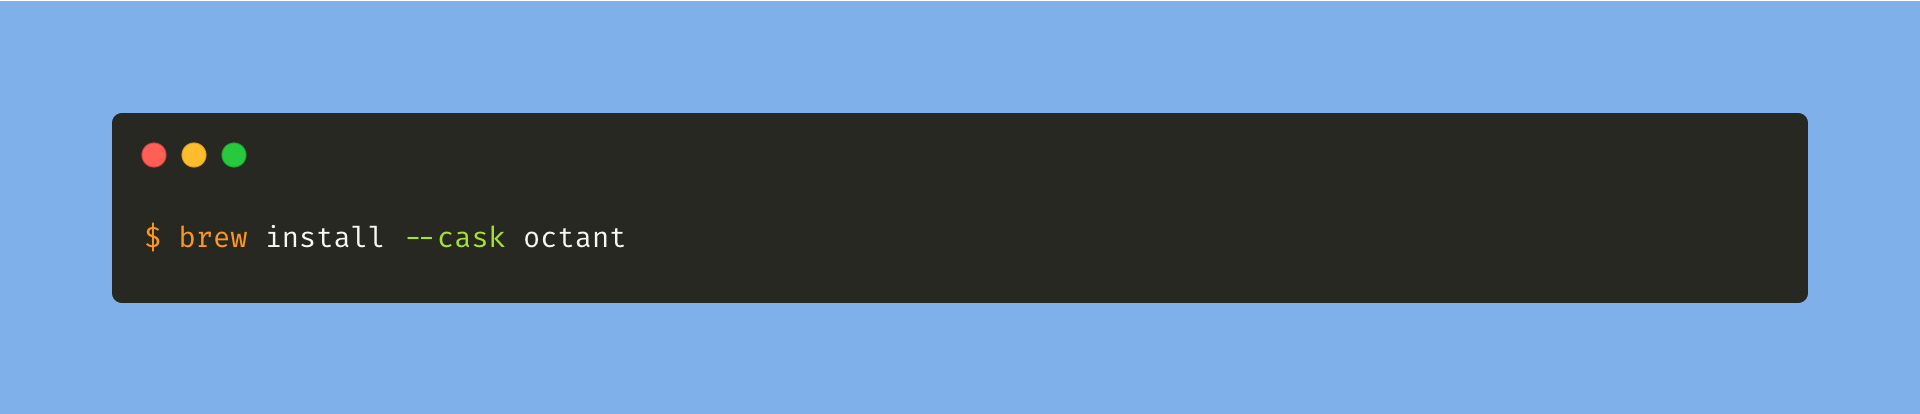
To install Octant on MacOS, follow this instruction:
For more information on the project, please refer to these external links:
Rancher
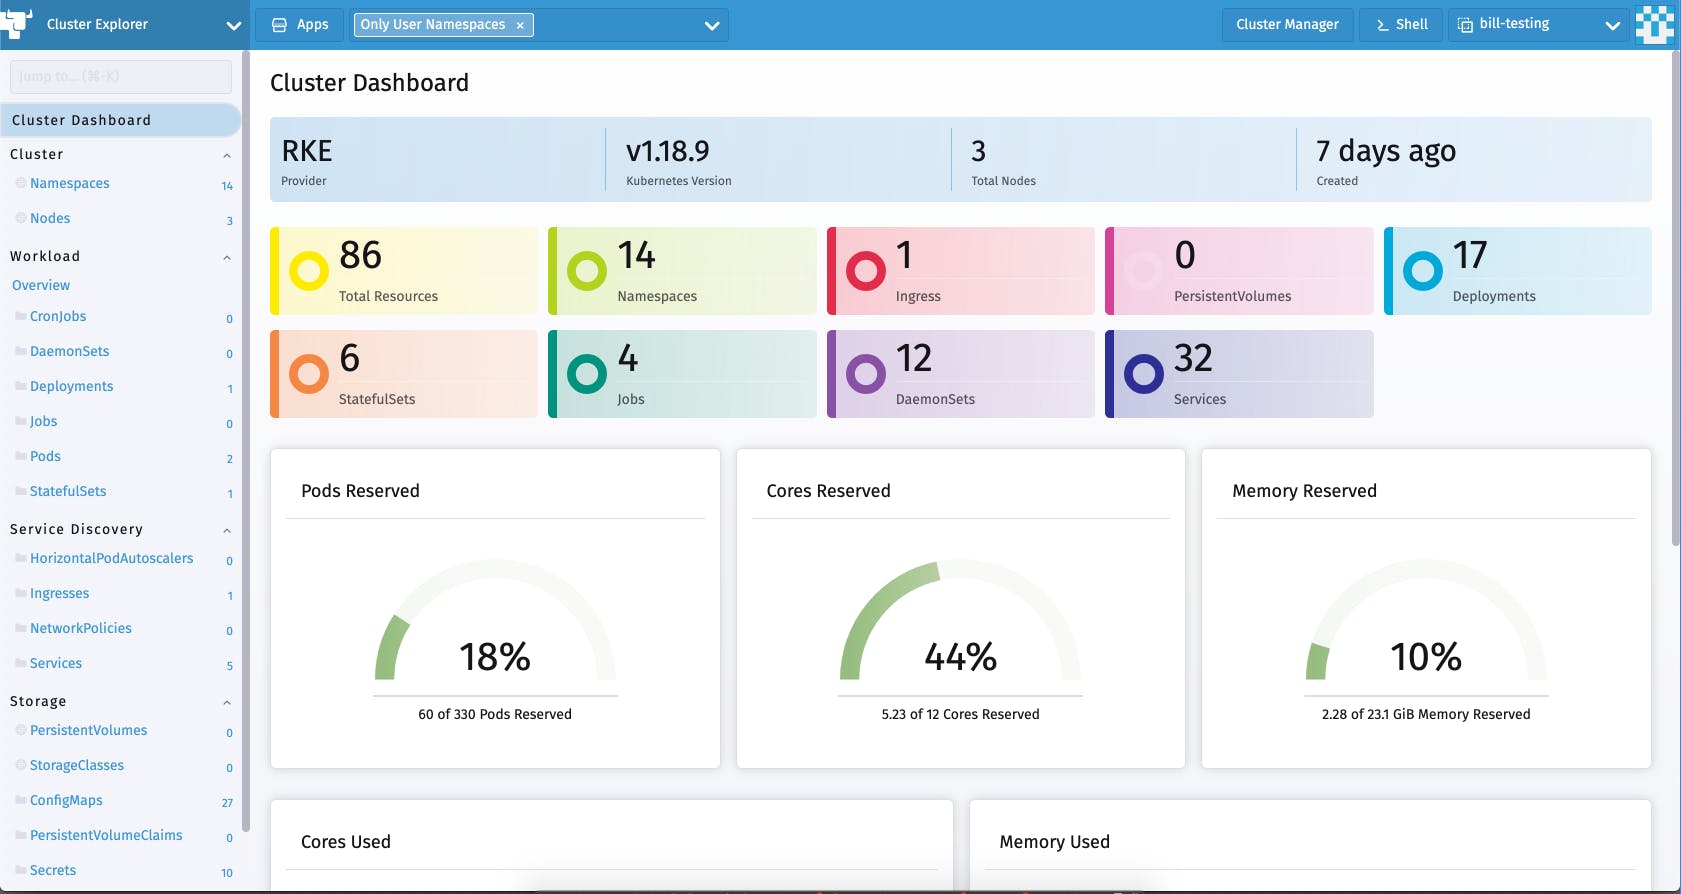
Rancher is the complete enterprise computing platform to run Kubernetes clusters on-premises, in the cloud or at the edge. So yes, Rancher is not really a Kubernetes Dashboard but it has the same functionalities, managing the life cycle of some Kubernetes resources, it can gather the logs and the metrics of the containerized applications, etc…
Like the other projects, Rancher can be connected to existing clusters but it can also create new ones. That is why, Rancher could be out of this scope as it can manage the life cycle of an entire cluster and not only resources.
But Rancher still has a dashboard UI to easily get access to any Kubernetes cluster and get quick insights.
The integration is different from the others as it needs an agent to be deployed on the remote cluster or a Cloud integration to manage Kubernetes. Rancher can be a centralized endpoint management for any team with a strong authentication mechanism, like an enterprise LDAP.
For more information on the project, please refer to these external links:
Kubevious
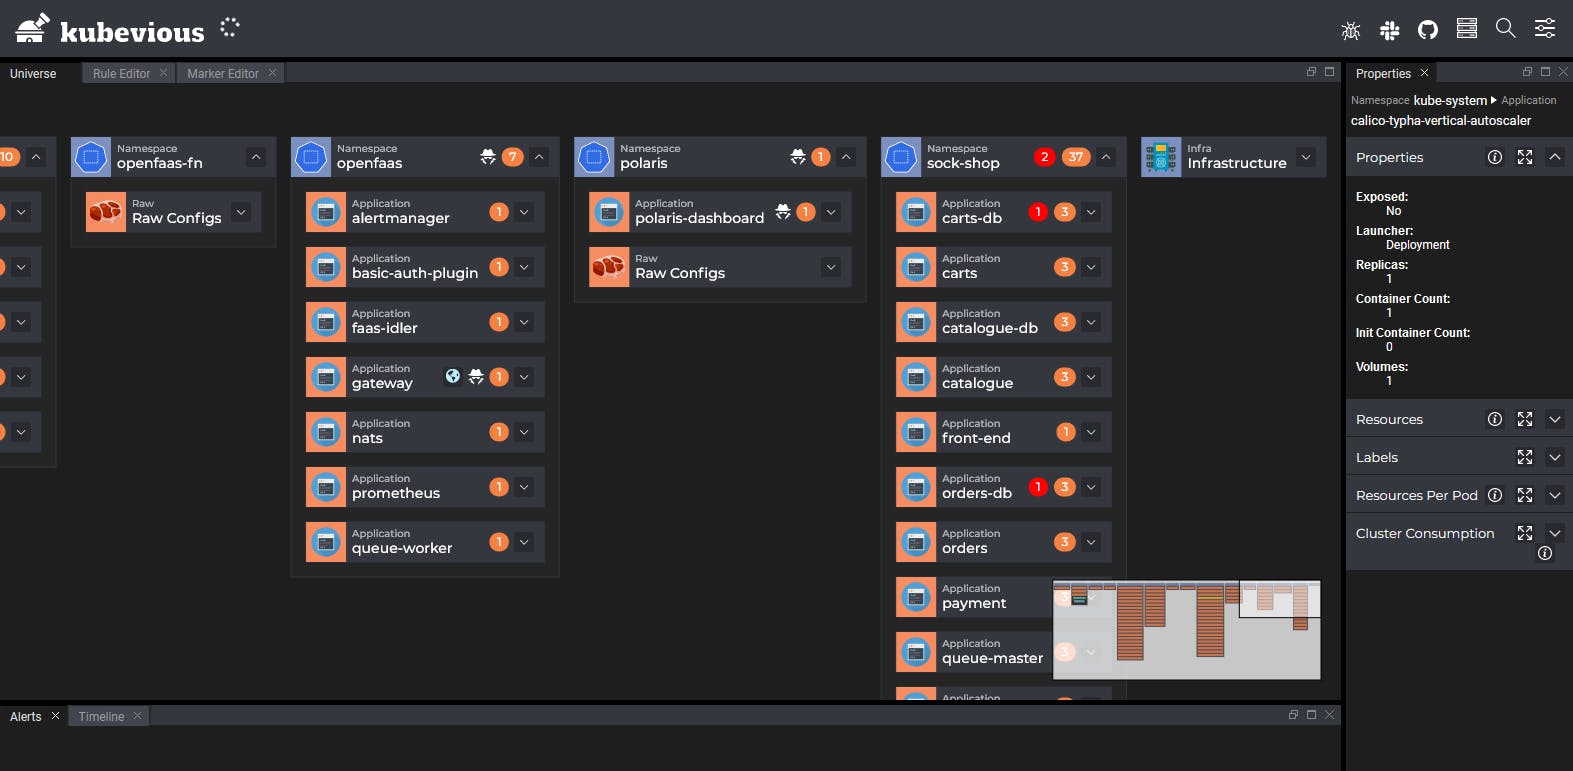
Kubevious is a new, very interesting Kubernetes dashboard that is a bit smarter to manage Kubernetes resources. Like the others, Kubevious can manage the life cycle of any resources in a Kubernetes cluster. It also has every required feature to troubleshoot the containerized applications deployed (container log, metrics, tags, description, etc).
Kubevious can be deployed on Kubernetes or as a standalone application outside a cluster. Similarly to Kubernetes Dashboard or Octant, it can be used as a centralized endpoint management for any cluster.
Compared to the others, Kubevious has many groundbreaking features:
- Cluster and config is an application centric view, deploying an application on Kubernetes requires different objects even for a simple app. Usually, it requires different commands to list and aggregate all the resources created. Kubevious is able to link each resource in a single expendable box or view to quickly get an overview of the entire application objects.
- Detects configuration errors, meaning it can identify many configuration errors, such as misuse of labels, missing ports, and others.
- Validation rules, custom rules can be defined to enforce DevOps best practices.
- Identifying blast radius, Kubevious can identify shared configurations and also displays other dependent objects.
This is just a subset of features that make Kubevious an interesting centralized Kubernetes Dashboard project. But as the others, authentication and authorization are a pain point and require to be managed externally.
To install Kubevious on Kubernetes, follow this instructions:
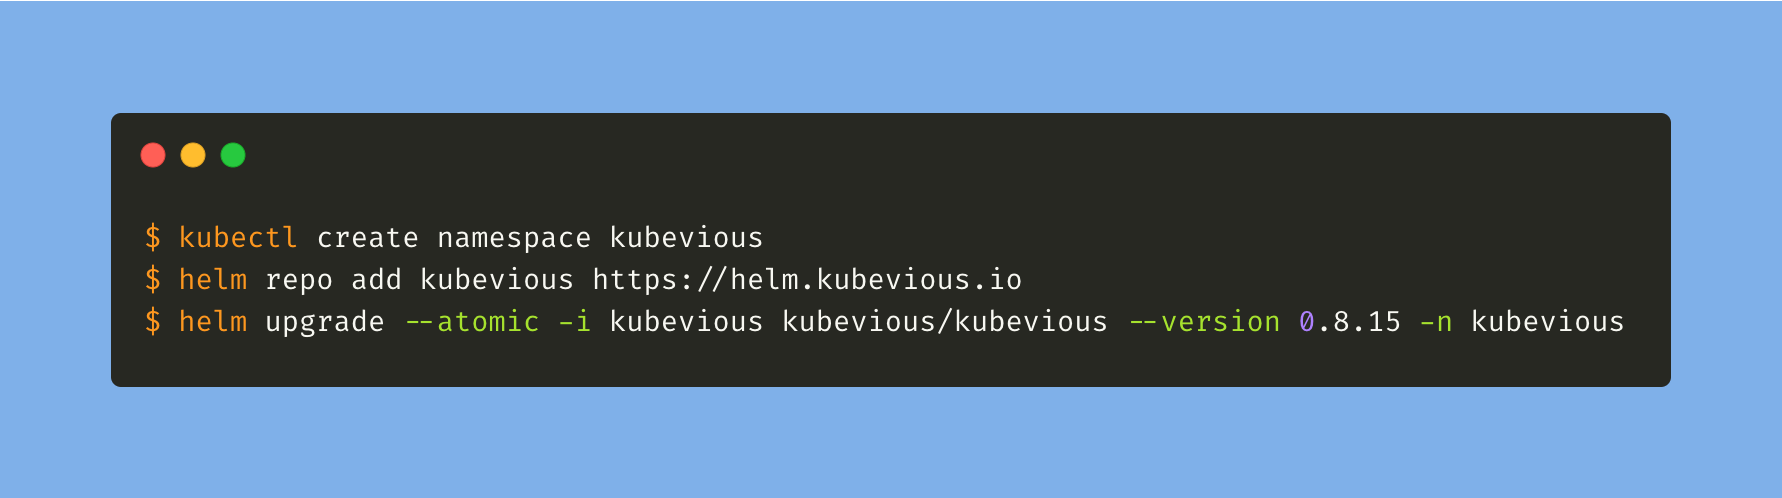
For more information on the project, please refer to these external links:
- Github repository
- Project website
- List of Kubevious features
- A revolutionary Kubernetes Dashboard for Cross-Checking and Validating your Kubernetes resources
Kubehelper
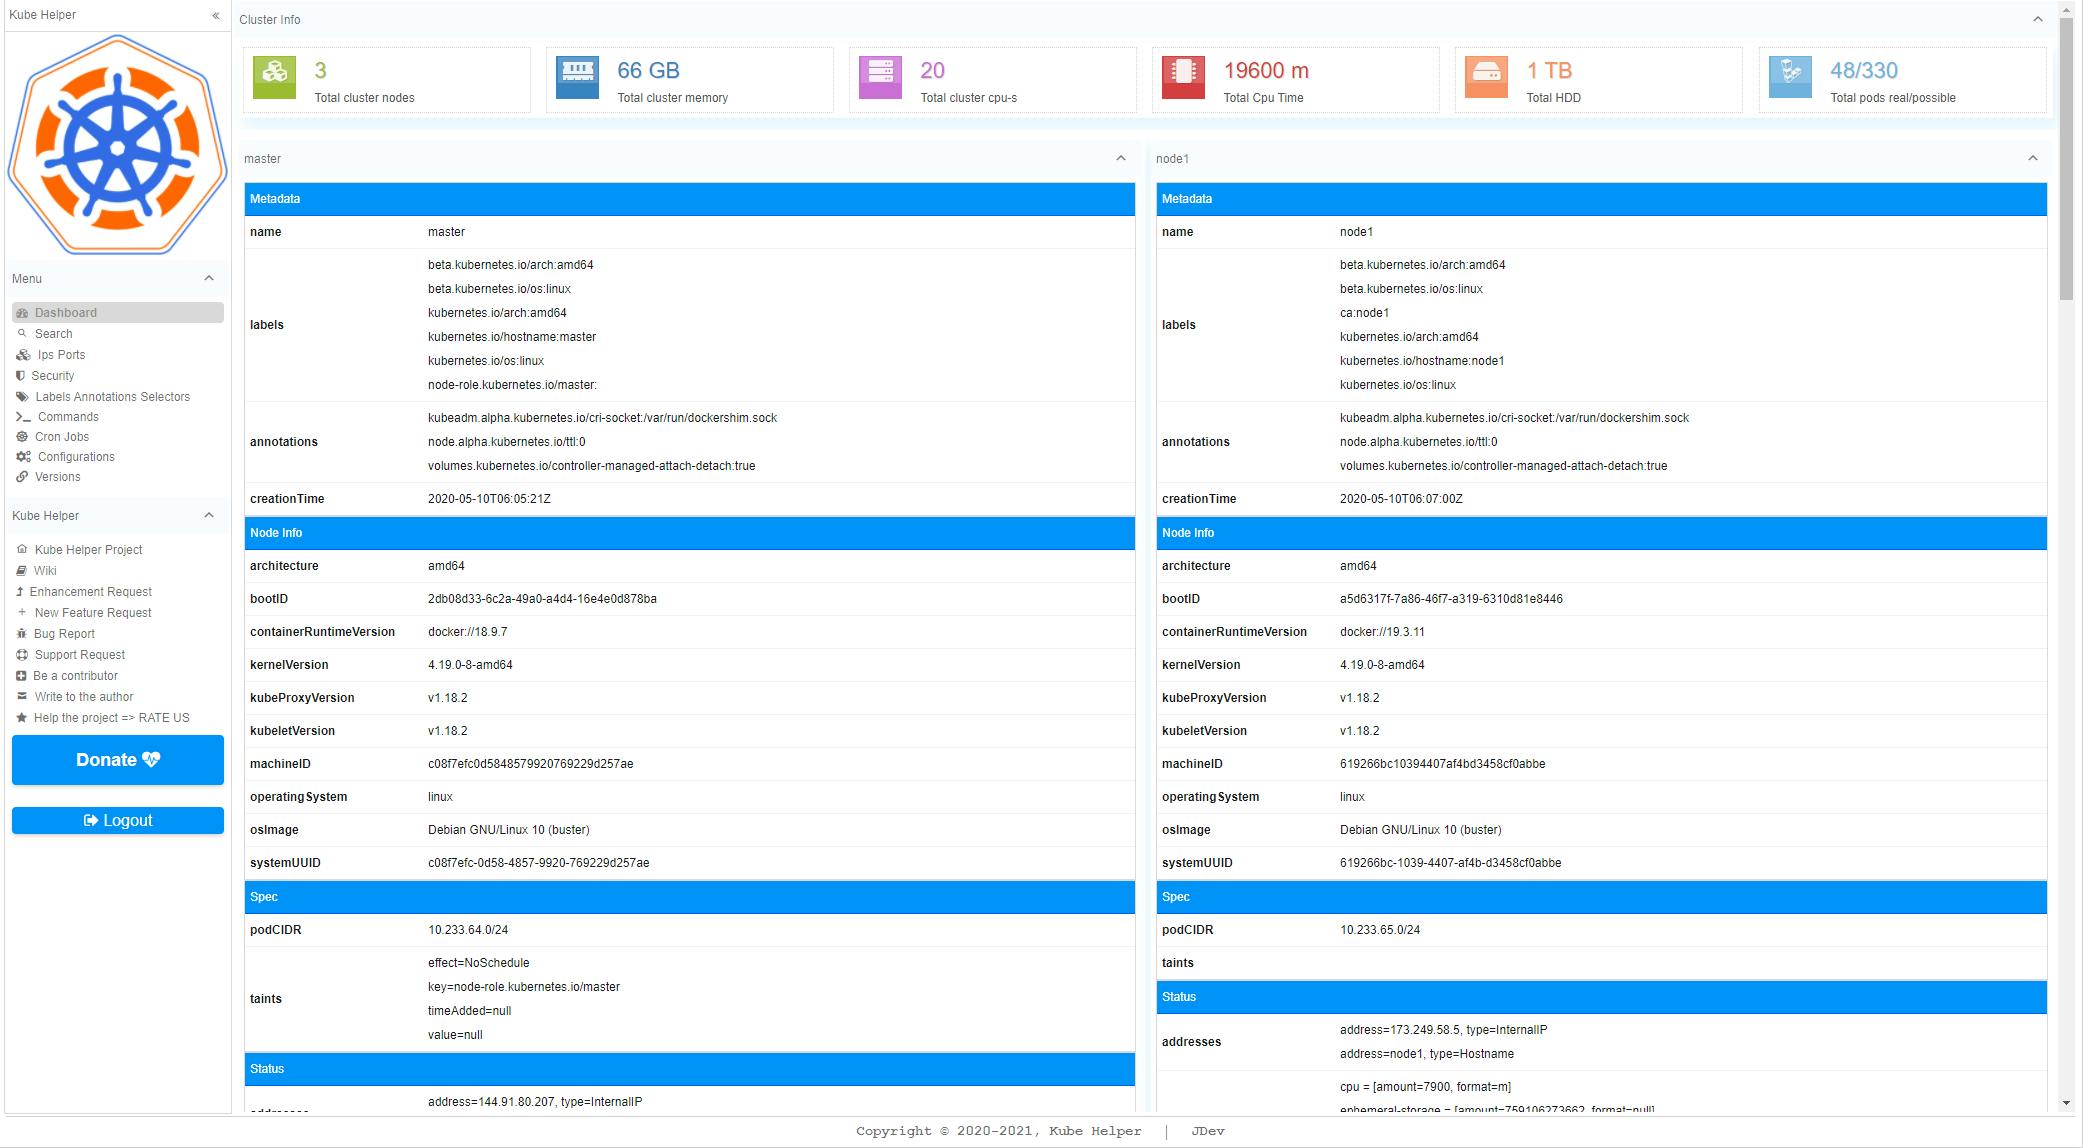
Kubehelper is a pretty new project that aims to simplify many daily Kubernetes cluster tasks through a Kubernetes Dashboard UI. Kubehelper comes with a list of pre-installed plugins to gather insights and render everything in a beautiful UI to apply actions based on CronJobs and shell commands. An interesting feature of Kubevious is its ability to view reports about executed commands for a certain period, like a history of every action / operation run on a Kubernetes cluster.
Like Kubevious, Kubehelper can be used to enforce DevOps best practices based on custom CronJobs tasks and keep a track of it over time. Because of the modularity of the project, the custom rules are not only based on default Kubectl built-in commands, but also all the plugins automatically installed.
Kubehelper requires different steps to be installed, please follow the instructions on the GitHub project to deploy it.
For more information on the Lens project, please refer to these external links:
Portainer
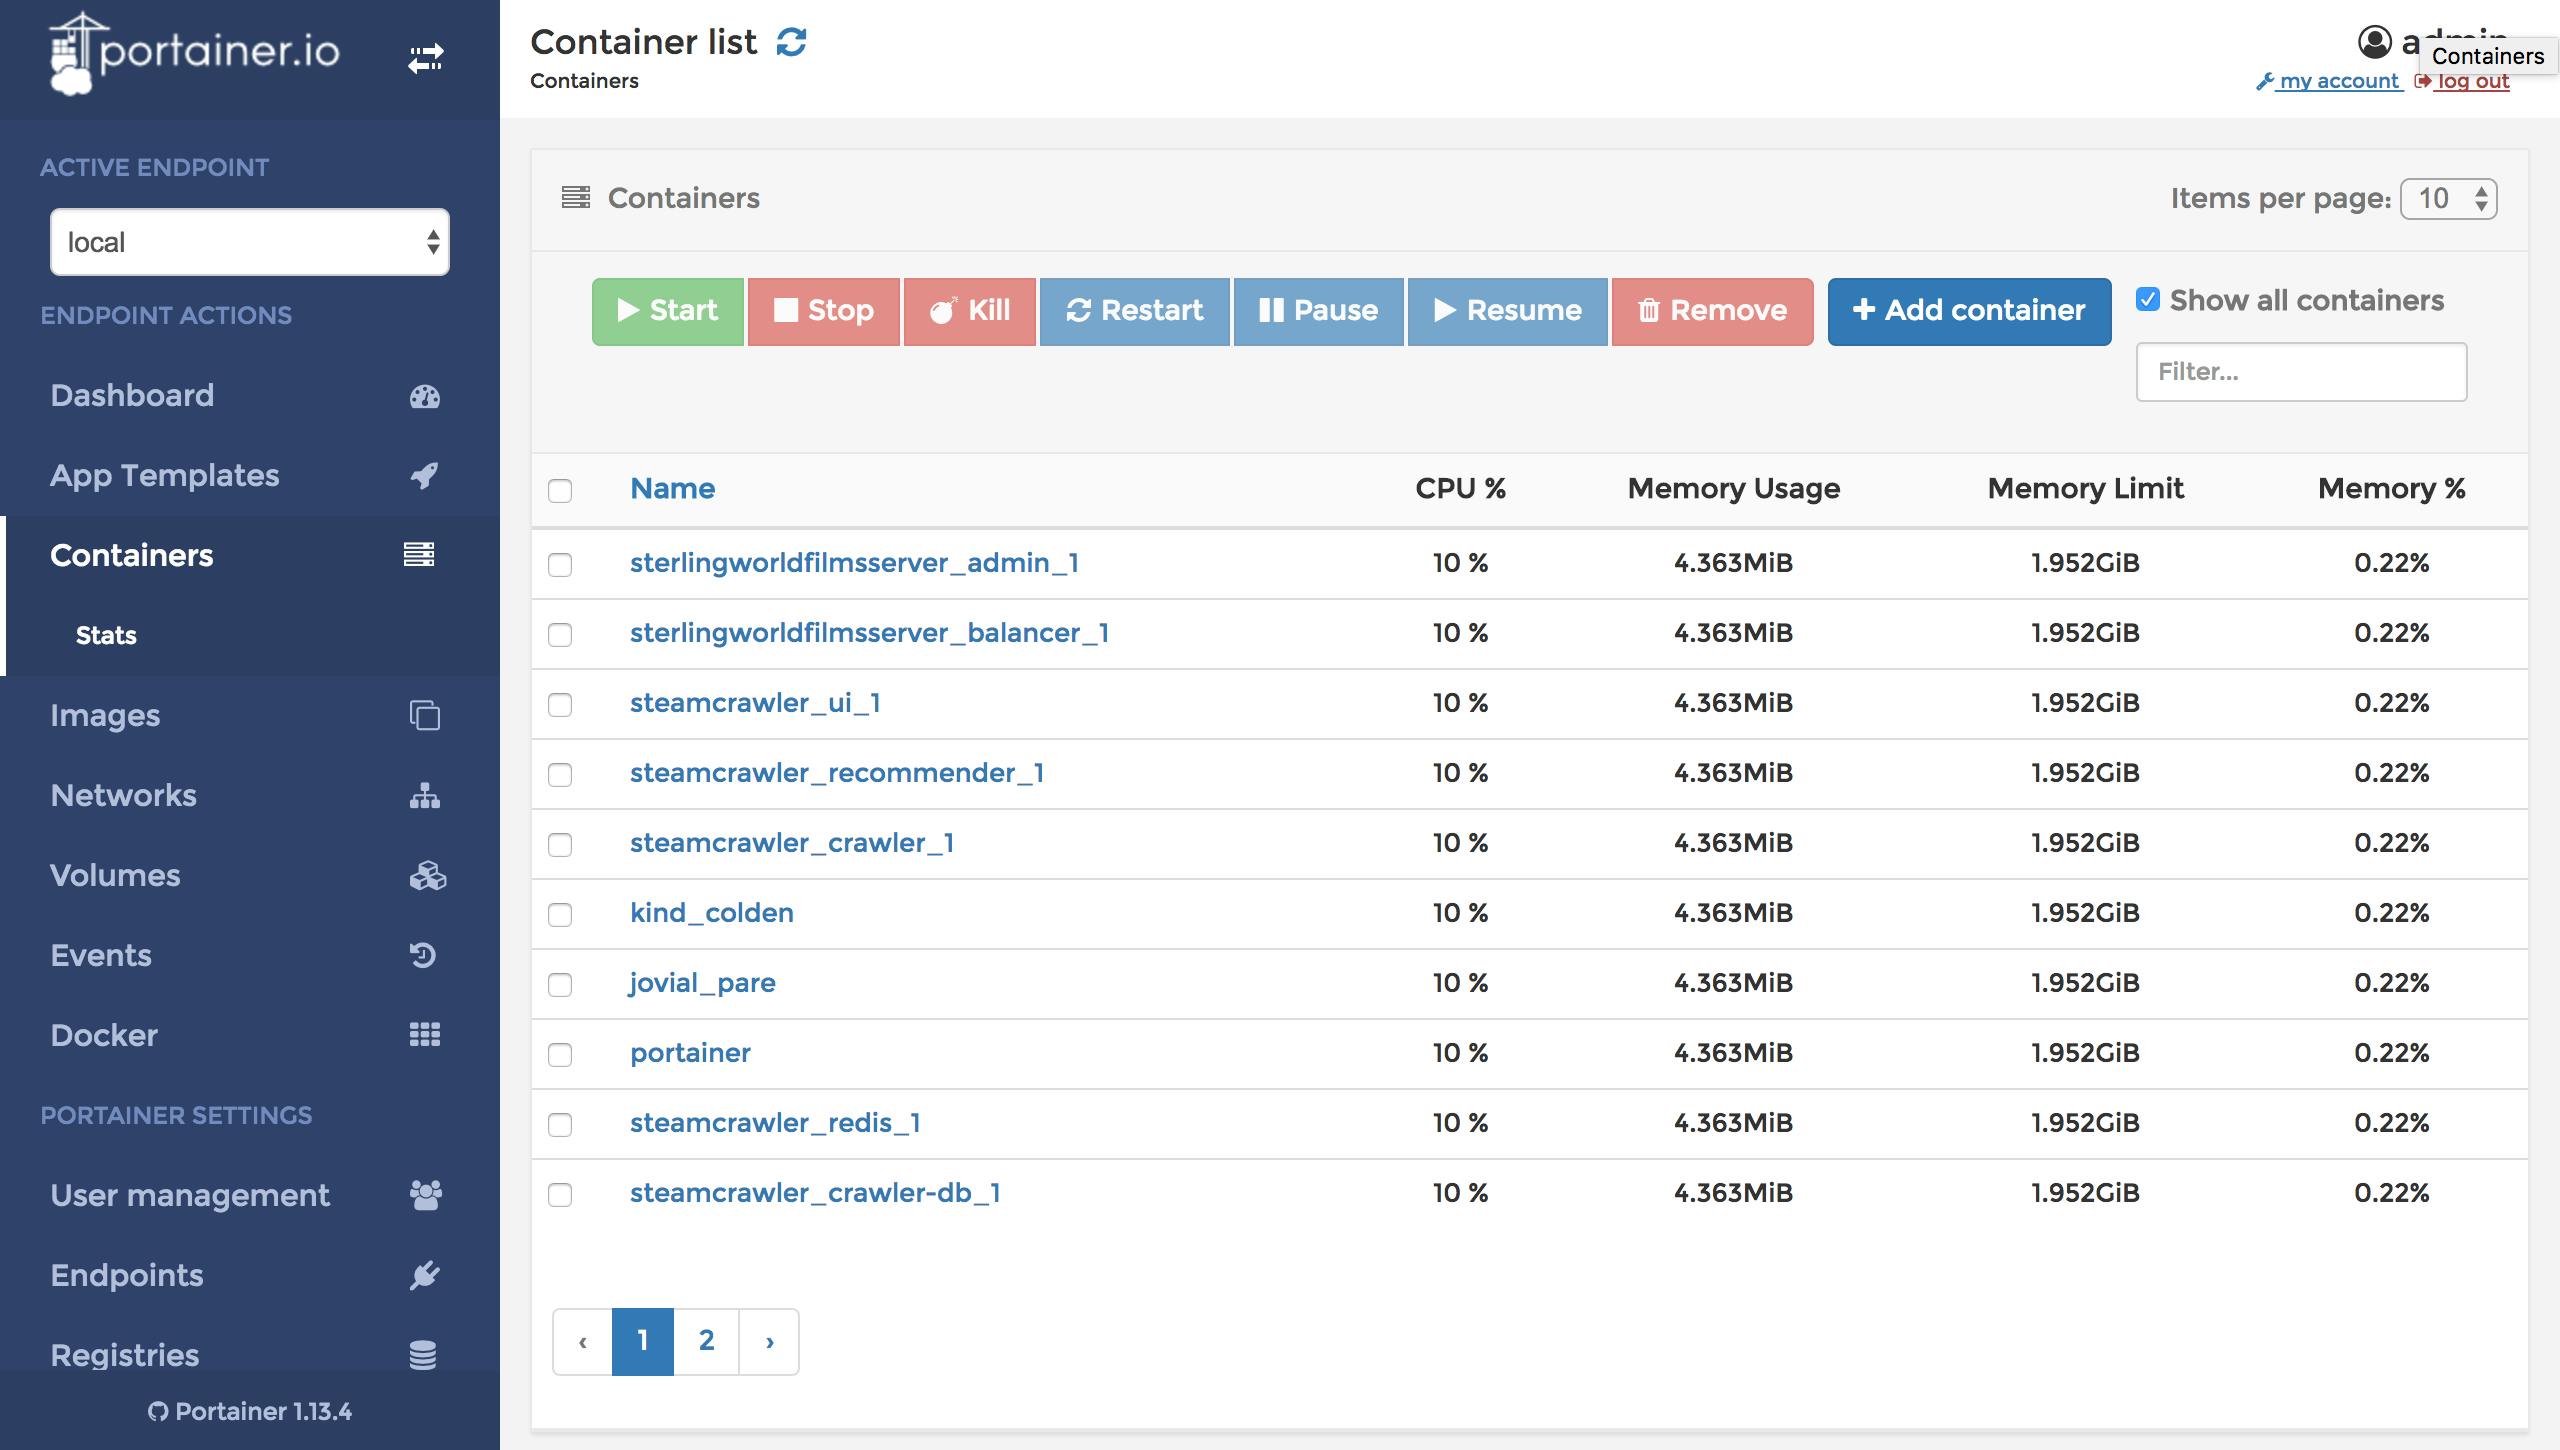
Portainer allows users to manage multiple clusters simultaneously from a single web UI, regardless of the orchestrator being used.
As Rancher, Portainer works with all flavors of Kubernetes (MicroK8s, K3s, K8s Native, OpenShift, AKS, EKS, DOKS etc.), either self-hosted or managed. Its intuitive interface allows users to manage, monitor and maintain every aspect of a Kubernetes environment.
Portainer provides all the required features to manage on a daily basis multiple Kubernetes clusters (application life cycle, log access, metrics, config file edition, etc…). Its ability to be connected to an LDAP makes this tool a good candidate for any enterprise requiring authentication and authorization management.
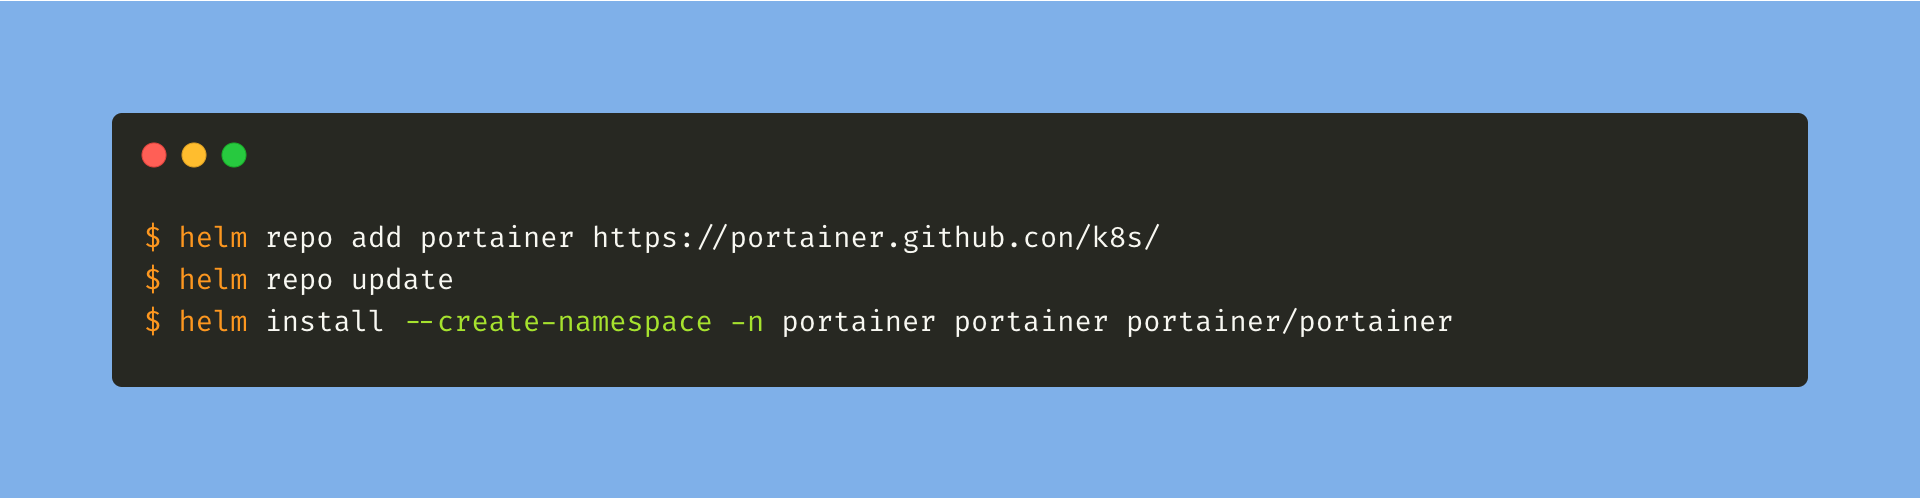
To install Portainer on Kubernetes, follow this instructions:
For more information on the project, please refer to these external links:
Skooner
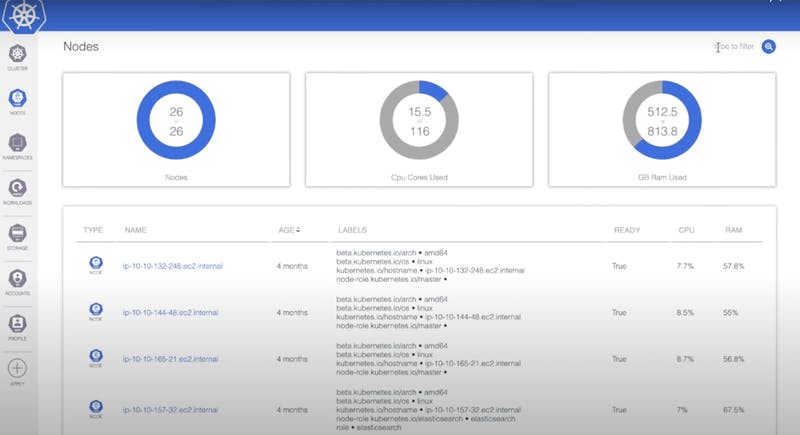
Skooner, previously known as K8dash, is an open-source real-time Kubernetes dashboard project.
Skooner is probably the closest project to Kubernetes Dashboard in terms of functionality. It provides an overview of the main Kubernetes resources in a nice dashboard like cluster resources, Deployment, Namespaces, Services, etc… To get this data, Skooner relies on metrics-server to pull runtime metrics.
Unlike with the Kubernetes Dashboard, Skooner comes with three different authentication methods: a service account token, OpenID Connect (OIDC), or via NodePort.
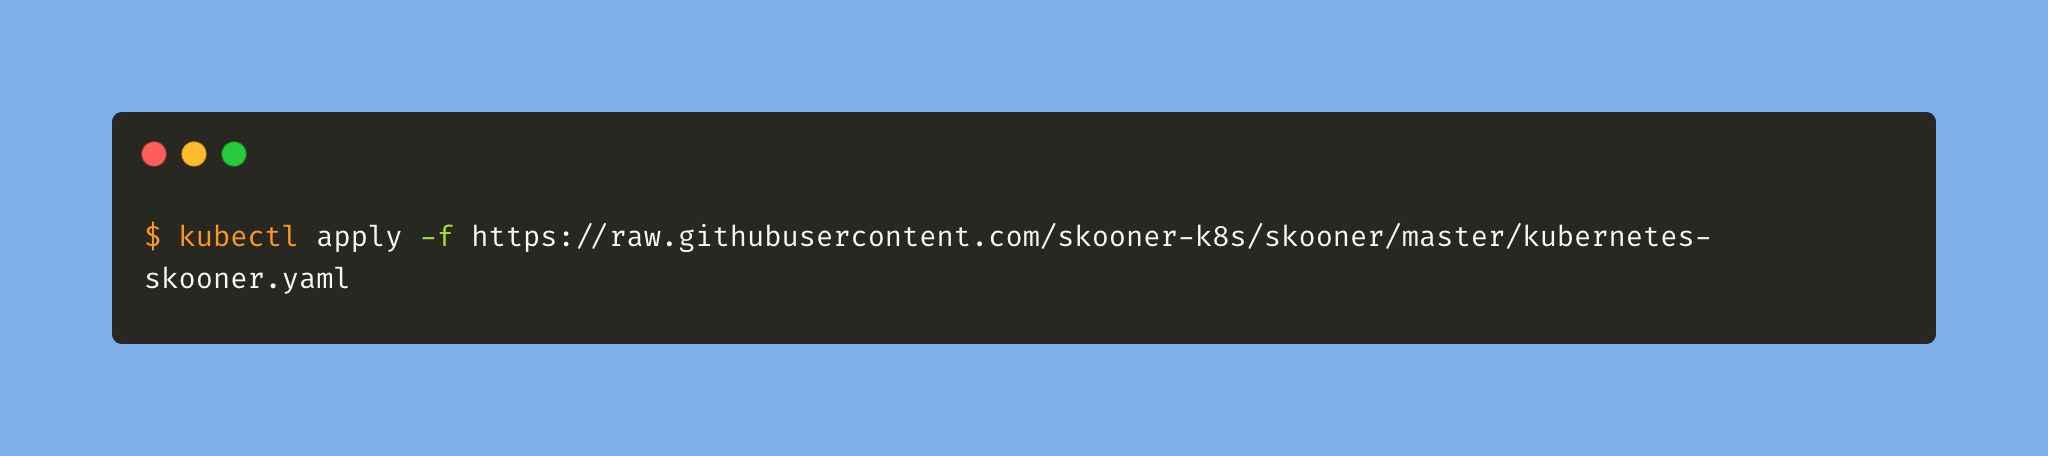
To install Skooner on Kubernetes, follow this instruction:
For more information on the project, please refer to these external links:
Kubenav
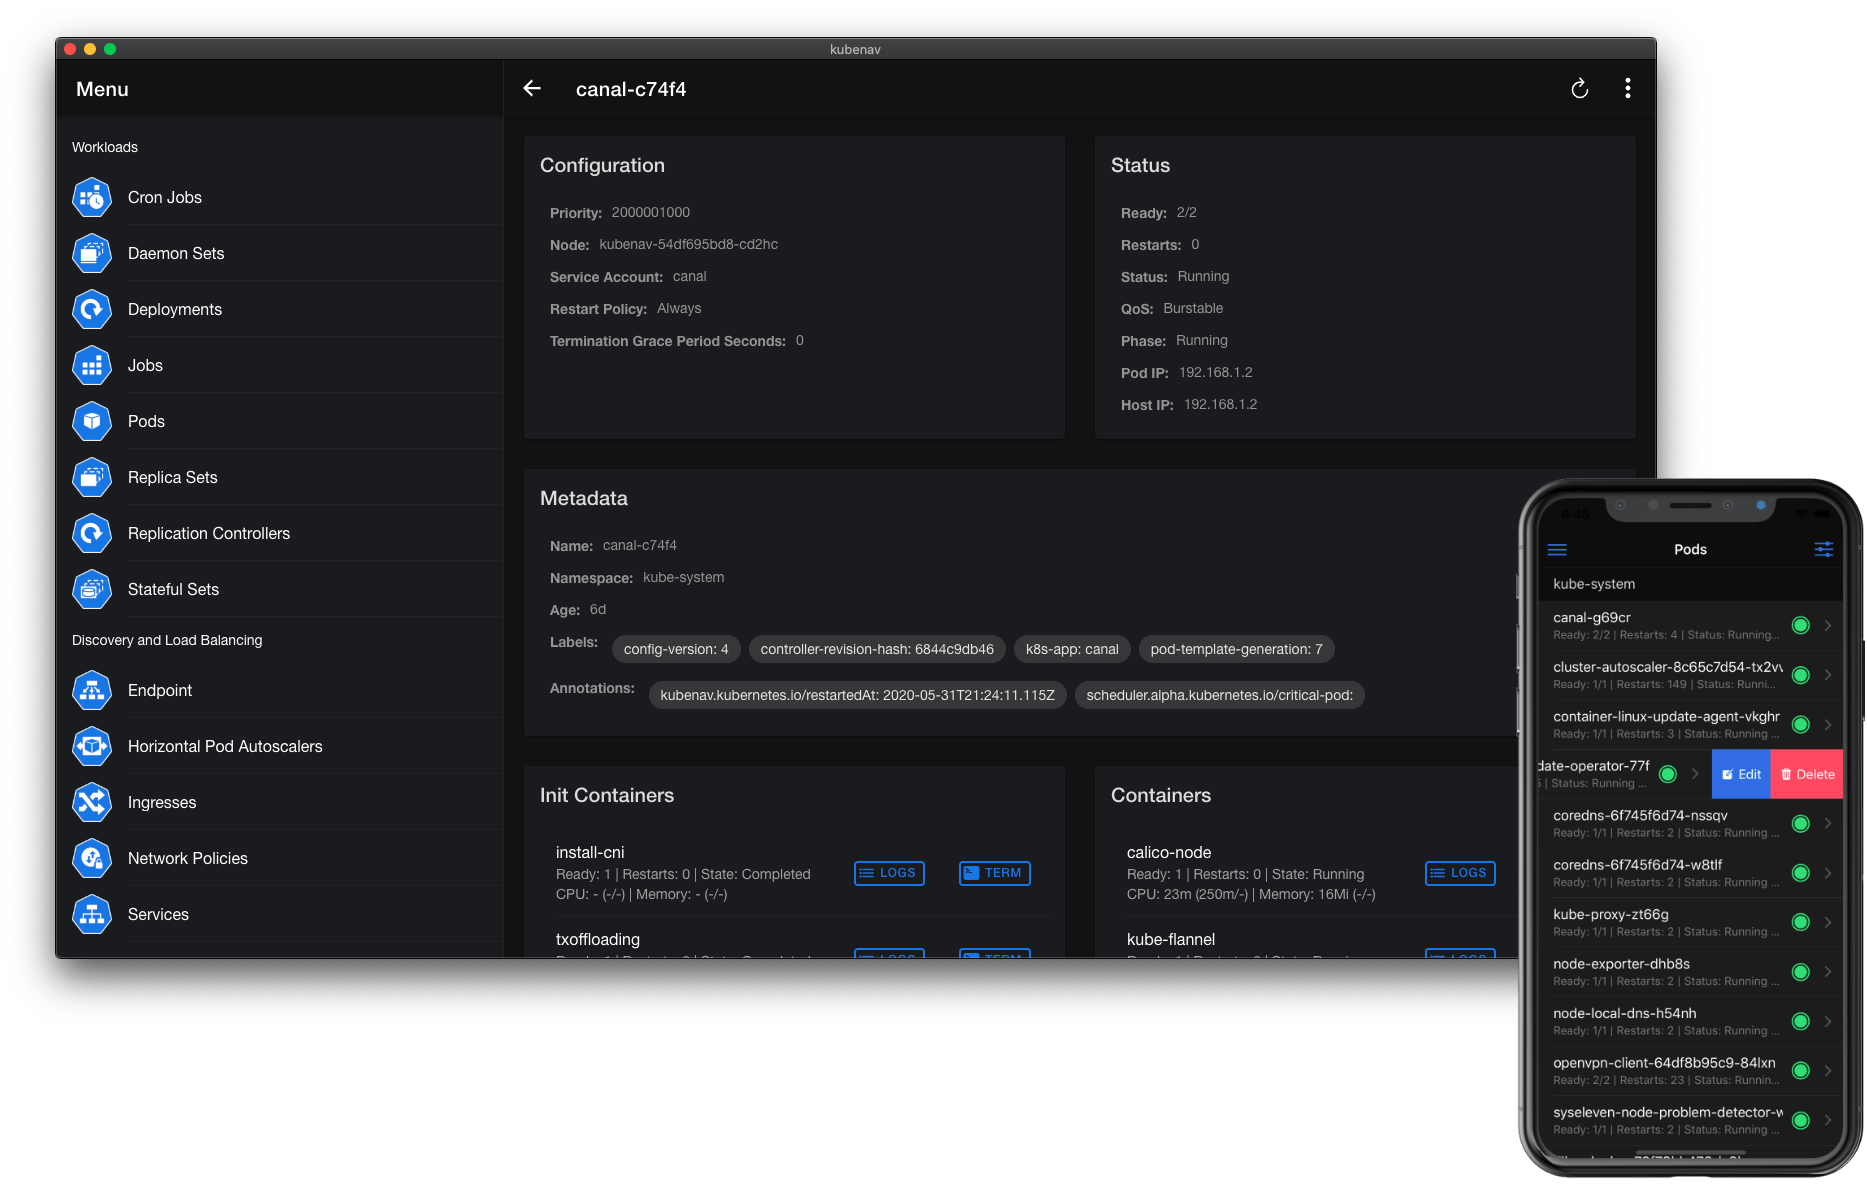
Kubenav is a pretty new project, not as complete as the others projects listed in this post, but it has a great developers team that tries to fix any issue as soon as possible and add new features in any new release.
Kubenav is a mobile (probably the only one today), desktop and web app to manage Kubernetes clusters and to get an overview of the status of resources.
The project is in development, so many features are missing to say that it is ready for production. But it deserves a mention as it can become a really interesting tool for any on-call Kubernetes operator.
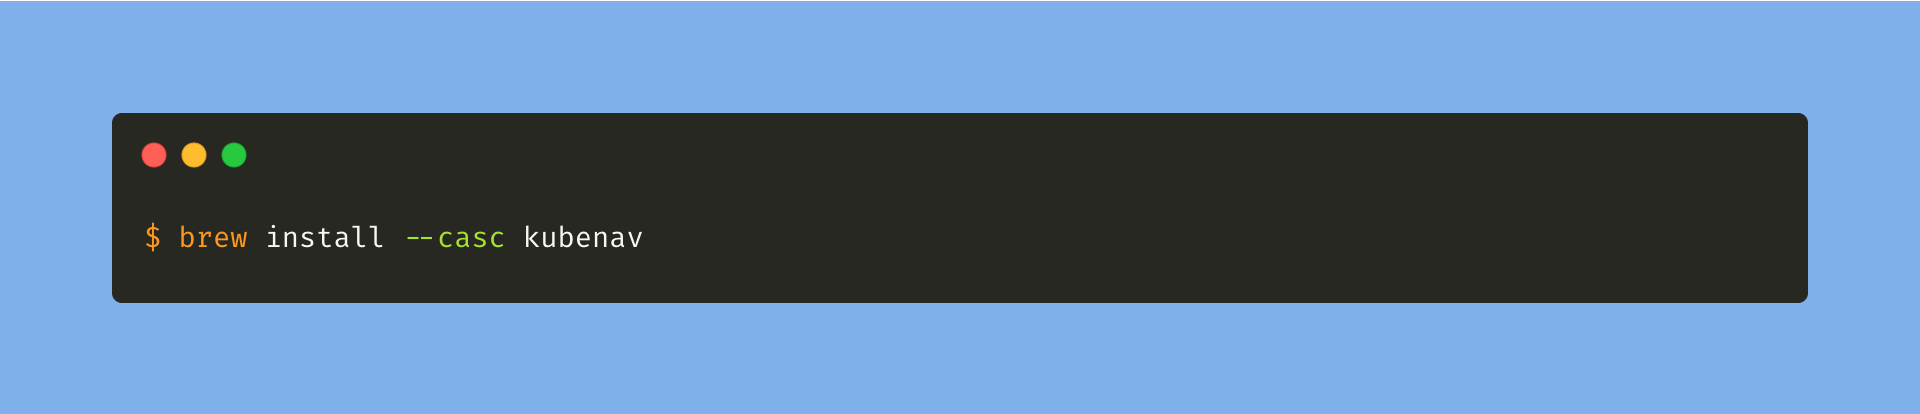
To install Kubenav on MacOS, follow this instruction:
For more information on the project, please refer to these external links:
Next?
In this post, we’ve only listed a few Kubernetes Web Interface dashboard projects. Obviously, there is more than that without mentioning the command line tools that can provide some of the features listed in this post.
Feel free to add any missing projects in the comments or share your favourite one!
For more information on the projects listed in this post:
About the authors
Hicham Bouissoumer — Site Reliability Engineer (SRE) — DevOps
Nicolas Giron — Site Reliability Engineer (SRE) — DevOps