

Observability and GitOps
A quick overview of the observability and her role in GitOps.


Observability is today a vital component of our architecture to manage a system properly, determine if it is working correctly, and decide what needs to be fixed, changed, or improved. Observability has been an area of interest in the cloud-native community for a long time, supported by the Cloud Native Computing Foundation (CNCF). Many projects and products are being developed to allow observability of systems and applications. The creation of a Special Interest Group for Observability (SIG) and the development of a framework (ie, the Open Telemetry project) prove the importance of this concept and the desire to standardize it.
This article deals with observability in the context of GitOps. As it was mentioned in the previous article, the key functionality of GitOps is comparing the desired state of the system, stored in Git, to the current state of the system and applying the required changes to make the two converge. GitOps relies on a controller that manages and controls the remote resources. This means GitOps relies on the observability of the controller to identify the actions that need to be performed. But GitOps is also a system that must provide observability. What is observability?
The old supervision methods have reached their limits in the supervision of the new standards of application architecture. The management of highly scalable and portable micro-services requires the adaptation of tools in order to facilitate debugging and diagnosis at all times, thus, requiring the observability of systems.
Often, monitoring and observability are confused. Basically, the idea of a monitoring system is to get a state of the system based on a predefined set of metrics to detect a known set of issues. According to the SRE book by Google, a monitoring system needs to answer two simple questions: “What’s broken, and why?”. Analyzing an application over the long term makes it possible to profile it in order to better understand its behavior regarding external events and thus, be proactive in its management.
Observability, on the other hand, aims to measure the understanding of a system state based on multiple outputs. This means observability is a system capability, like reliability, scalability, or security, that must be designed and implemented during system design, coding, and testing.
The purpose of this concept is to control what is happening to a system to answer this kind of questions :
- What version of an application was most recently deployed and by whom?
- Can we decrease the number of replicas without impacts on the performances?
- How does a micro-service interact with another one? Can it be a bottleneck?
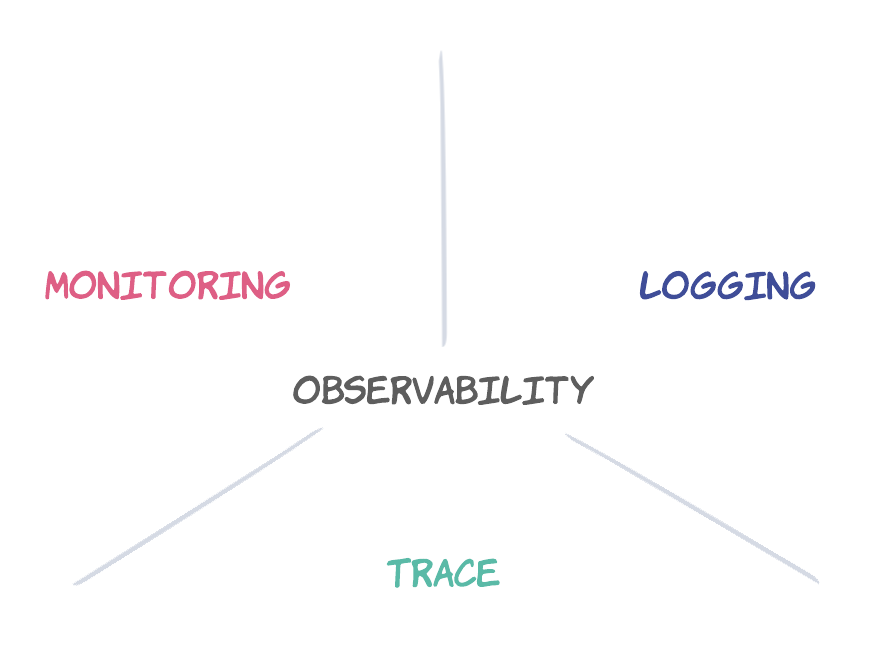
The observability completes the monitoring based on three pillars: the logs, the metrics and the traces. Monitoring tells when the state is wrong while the observability tells why. Monitoring is a subset of and key action for observability.
What to observe and why?
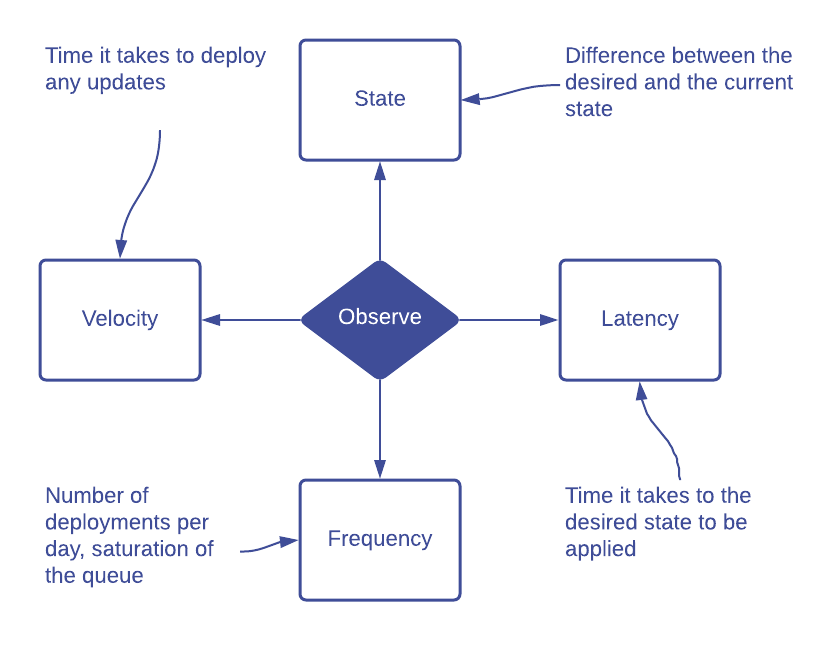
The observability has obviously no limit, it depends on the context (the monitoring metrics, the log management, etc), the time allocated to the implementation, the type of person targeted (is it a dashboard for a developer, a sale, a manager?), etc. But there are some overall parameters that have to be observed.
The desired state vs the current state
The first and probably most important aspect to observe is the difference between the desired state stored in a Git repository and the real current state of the resources.
It is important to oversee this link between the desired state and the current state to ensure that the last updates are correctly applied before asking for another change. This is a best practice for every automation tool result, debugging a simple change is easier than waiting too long and multiple changes to fix it.
The idea of this aspect of the observability is to answer this kind of questions:
- Was my last commit correctly applied to my system?
- If not, what happened exactly?
- Should I rollback to the last version of my repository?
- Is the system working as intended?
The deployment frequency
This is a crucial aspect to measure the impact of the GitOps methodology on the internal processes. The purpose is to move to a reliable system that can handle multiple deployments per day without (or with limited) impact on the business.
Automating internal processes like continuous integration, continuous testing, continuous deployment require a continuous observation to extract insights from it and improve each process based on the requirements of each team / project.
The deployment frequency is a good metric to understand if the internal processes are optimized or not. For example, the frequency is a good indicator of the quality of the development life cycle. Having a big difference between the number of deployments in the staging and production environment can reveal multiple issues in the SDLC like a poor automated tests process, a bad code quality, a bad development life cycle, etc.
The idea of this aspect of the observability is to answer this kind of questions:
- How many deployments are done per week? Per month? Per environment?
- How many deployments finished successfully?
- How many deployments failed or are out of sync?
- How many deployments introduced a bug or a regression?
The deployment velocity
An improvement of the deployment frequency is usually followed by an improvement of the deployment velocity. Indeed, deploying more frequently usually means that the updates are small so easily manageable. The velocity is the result of the tendency to deploy micro changes more frequently allowing better control on the infrastructure in order to minimize impacts. Also, increasing velocity can help to meet RTO/RPO requirements in case of an outage.
The idea of this aspect of the observability is to answer this kind of questions:
- How long does it take to deploy a new feature?
- How long does it take to deploy a fix?
- How long does it take for a new guy to deploy his first change ?
The deployment latency
Latency related metrics help understand the behavior of the controller, and more precisely, what amount of time does the controller take to really apply the changes. Understanding how the controller works and the different stages that are implemented in the process can help reduce the latency and increase the velocity even more by making the current state converge faster to the desired state.
The idea of this aspect of the observability is to answer this kind of questions:
- How long does it take for the current state to match the desired state?
- How many pending tasks are in the queue?
- Is there out of sync deployments?
How to observe?
The how-to depends on multiple factors, the idea obviously is not to introduce a bunch of new tools that will also need observability. The first thing to do is probably to rely on the existing monitoring and logging tools to grab and present the data in a nice dashboard.
But as the GitOps community grows, interesting projects emerge and deserve special attention.
Keptn
Keptn is a control-plan for DevOps automation of cloud-native applications. It’s a SLO-driven multi-stage delivery tool that automates the observability and the alerting.
This project has been initially created by Dynatrace and it’s now managed by the Linux Foundation as a sandbox project of the CNCF.
Keptn has the faculty to be integrated into multiple known tools like Argo, Gitlab, Jenkins, Prometheus, Locust, Slack, etc. Keptn, with his Quality Gate, adds another layer to the quality evaluations of any pipelines. Thanks to the Quality Gate, Keptn can prevent shipping bad code to production without any human qualification.
Open Telemetry
Open Telemetry is currently a sandbox-level project managed by the CNCF. Open Telemetry provides a single set of APIs, SDKs, and tooling for the collection of telemetry data (metrics, logs, traces) from various programmatic languages (Java, Python, JavaScript, etc). The aim is to define a centralized collector and exporters, to send data to various backends. The definition of this standard is being backed by a number of leading monitoring companies, who all believe that a standard framework is the future of instrumentation.
Open Telemetry tries to fix one big problem in observability, rather than having to manage agent software for individual IT management tools, it will soon be possible to deploy a single set of agent software to generate data that can be consumed by multiple platforms. The main purpose is to not focus on the tool used to send data to multiple vendors but on the data itself.
This kind of framework is definitely the right way to standardize the collection of metrics, logs or traces to quickly get insights from applications, systems, pipelines, etc. and by the same way improve the observability of an entire infrastructure.
Custom process
As previously said, the first thing to do is probably to rely on existing tools and process and improve them. You might already have a pipeline that pushes the changes into your environment after merging a pull request; or, in GitOps words, a controller that is responsible for synchronizing the desired state with the current state. This existing pipeline could send metrics to improve observability. The continuous integration tool can probably log information in a file that can be consumed by a log management process.
For instance, notify an external system (NewRelic, Prometheus, Signoz, etc) every time a deployment succeeds or fails; the system could even notify when the synchronization has been initiated and when the system is actually synchronized, or not. This could help to measure the latency, as well as calculating a ratio between successes and failures of deployments, and therefore, improve deployment frequency. This is how observability can improve overall SDLC quality.
Even though new tools are flooding the market, it is also possible to implement GitOps observability with existing tools and processes.
Next?
GitOps is a huge improvement for the management of an infrastructure and requires the right level of monitoring and observability to be efficient.
The purpose of this article was to provide an overview of the observability with GitOps and some interesting projects that should help to improve the collection of data to improve the GitOps workflow. Obviously, one article is not enough to explain all the aspects of the observability with GitOps, that’s why in the next article, we will talk about how the GitOps methodology and the observability can improve some security aspects of the infrastructure management. Stay connected!
For more information on the observability in the GitOps methodology:
- GitOps and Kubernetes book
- CNCF Observability SIG
- Monitoring vs Observability
- Observability will never replace monitoring
- Keptn project
- Shifting SRE left with Keptn
- OpenTelemetry project
About the authors
Hicham Bouissoumer — Site Reliability Engineer (SRE) — DevOps
Nicolas Giron — Site Reliability Engineer (SRE) — DevOps